
- Solve real problems with our hands-on interface
- Progress from basic puts and calls to advanced strategies
Interactive Options Course
Lesson 4 of 13
Already an Interactive Brokers Client?
New to Interactive Brokers?
The Performance Profile is available for stock and options for you to consider potential profit and loss values through and at expiration. The chart displays a solid line for at expiration values and a dotted line depicting p/l using the as-of date determined using the date selector.
How to Access
The Performance Profile is available from several locations:
Let’s walk through the three areas displayed in Performance Profile. For this example, we’ll use a simple long call option position.
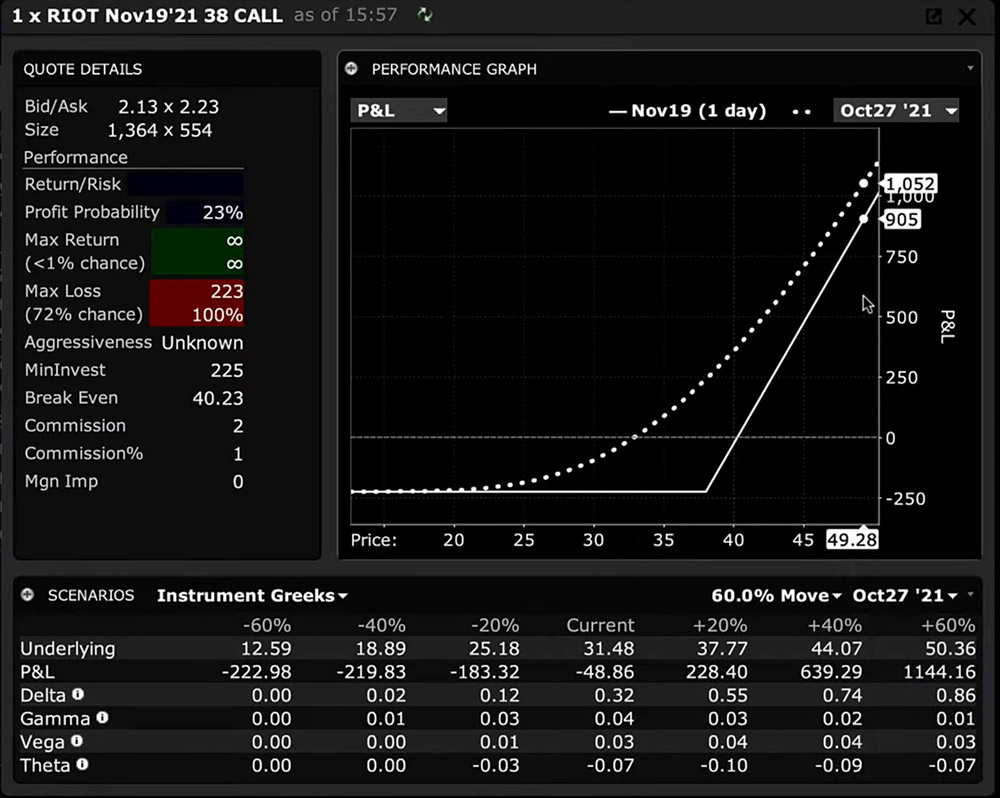
Quote Details – The Quote Details area shows market metrics and defines the potential risk and rewards associated with placing this trade. The trade specifics are shown to the upper left. And the option quote is displayed beneath. Add the premium to the strike price and you can determine the Break Even value displayed below.

The Profit Probability is ranked in percentage terms and is a function of the number of days to expiration and how far the strike price is away from the price of the underlying.
The Maximum Return from a long call is infinite, since the price of the stock could go up and up and up. Remember, the downside risk for any stock is always to zero but is not infinite. The Maximum Loss from buying a call is defined as the premium paid.
An option buyer can only ever lose the amount of premium, plus any associated commissions, but that is all. The minimum investment is calculated by multiplying the premium paid for the call option by 100 shares + commission. You’ll also see the Margin Impact of buying the call option.
Scenario Panel – The Scenario Panel allows you to perform a scenario analysis allowing for changes in the price of the underlying and change in time. Note the two dropdown menus to the right of this panel. You can vary the size of the price move shown in the chart between 5-100%.
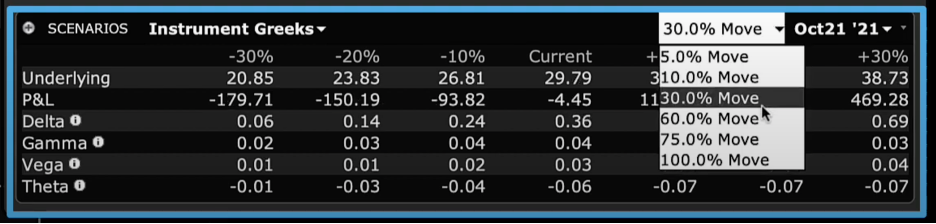
That will change the display on the Performance Graph above and the matrix in the Scenario Panel. Second, you can change the date through expiration. If you loaded an option combination with two different dates, such as a calendar spread, you will be able to choose through the first of those expiration dates.
See the current price of the underlying and calculates up and down changes for the underlying according to the percentage movement you choose from the dropdown. The associated P/L is displayed on the second row for each price change. Now, when you step through time by selecting a different date using the calendar dropdown menu, you will see P/L and other matrix values vary.
Performance Graph – The Performance Graph allows you to visualize and compare one day at a time versus the expiration date for several variables. The solid white line is the expiration view, while the dotted line always represents the date chosen from the calendar dropdown menu in the upper right corner. By default, you are looking at P/L. Select from the list of P/L and Greek variables from the selector to the upper left of the Performance Graph. For greater granularity, you may want to reduce the price range in the Scenarios panel to a smaller value.
Change the date to see how P/L or the Greek variables shift towards expiration.
Hover your cursor over the dotted line to see associated P/L or other variables as selected from the dropdown menu.
Use one symbol with two expirations to exemplify this concept.
Example 1. Risk and Chance of Profit – To illustrate the chances of potential profitability, let’s take this stock XYZ and highlight side-by-side the Probability of Profit.
With the underlying trading at $40 by selecting a $50 strike price at different expirations, you can see that for the option with the shortest expiration date, the Probability of Profit is less than the Probability of Profit when the option has longer to run. This can be a useful feature to focus on when considering the potential for gains and losses at far out-of-the-money call and put options.
Example 2. Decay of an Option – To illustrate how time decays the premium of an option, you can view the value of Theta or the rate of change in the premium for each day closer the contract is to expiration. Reading from the matrix (and mark on the plot) this out-the-money 90-day contract currently displays a Theta value of -0.05. That means that, should the price of the underlying remain static overnight, the premium should lose approximately 5-cents by tomorrow. Notice too that Theta is greater at higher prices.

Now, fast forward to one week prior to option expiration to show that Theta at the current price is -0.08 or 8 cents, and that should price increase Theta or the rate at which the option decays is greater.

This is valuable information for an option trader from the perspective of both buyer and seller. A buyer needs to be aware of how quickly the premium is eroding if the option is still out-of-the-money towards expiration. If bought for protective purchases, the buyer might consider rolling to a further maturity. An option seller might want to know which option to write to maximize time decay for out-the-money options.
The Performance Profile is a valuable tool when evaluating trades. Explore by understanding the Risk metrics and remember to change both the date and variable on display to fully understand potential scenarios.
Additional Links
For specific platform feedback and suggestions, please submit it directly to our team using these instructions.
If you have an account-specific question or concern, please reach out to Client Services.
We encourage you to look through our FAQs before posting. Your question may already be covered!
The analysis in this material is provided for information only and is not and should not be construed as an offer to sell or the solicitation of an offer to buy any security. To the extent that this material discusses general market activity, industry or sector trends or other broad-based economic or political conditions, it should not be construed as research or investment advice. To the extent that it includes references to specific securities, commodities, currencies, or other instruments, those references do not constitute a recommendation by IBKR to buy, sell or hold such investments. This material does not and is not intended to take into account the particular financial conditions, investment objectives or requirements of individual customers. Before acting on this material, you should consider whether it is suitable for your particular circumstances and, as necessary, seek professional advice.
The views and opinions expressed herein are those of the author and do not necessarily reflect the views of Interactive Brokers, its affiliates, or its employees.
Options involve risk and are not suitable for all investors. For information on the uses and risks of options, you can obtain a copy of the Options Clearing Corporation risk disclosure document titled Characteristics and Risks of Standardized Options by going to the following link ibkr.com/occ. Multiple leg strategies, including spreads, will incur multiple transaction costs.


In the performance graph, considering wide bid-ask spreads, what entry is used for determining the P&L: bid, ask or mid-point for a buy or sell order?
Hello, thank you for reaching out. The spread is irrelevant because the software assumes that the buyer of a strategy has to pay the Ask price to make the trade. The trade parameters flow from there, since the P/L Performance graph is through expiration. The plot measures (dollar-wise) P/L associated with where the investor gets out of the trade (or simply lets it expire without a closing trade) based upon the entry price, as defined by the Ask price. On the other hand, if an investor was examining a short strategy, the software would assume that in order to enter the trade, they would need to do so at the best bid price. We hope this helps!
Is it available in the mobile App also?
Hello Max, thank you for reaching out. The Performance Profile is not available on IBKR Mobile. The Performance Profile is available from these three locations, stated in the article:
From the New Window button locate and expand Option Analysis and select the Performance Profile. The software will populate with the active ticker – the one you last interacted with.
From within the Strategy Builder as you are creating a combination locate and click the Performance Profile button to evaluate the trade you are building.
If you have a simple option position or a multi-legged combination in a Watchlist or your Portfolio window, you can right click on the position or symbol row, look for Analytical Tools and open the window by selecting Performance Profile.
We hope this answers your question.
Hello, just a few suggestions that I think would really help improve the performance profile.
1. The ability to zoom in and out of the graph area.
2. Markers on the graph that reflect current breakeven as well as expiration breakeven.
3. Markers on the graph that reflect current price.
4.The ability to move price manually and define the P/L as well as greeks at the price of my choosing and not be limited to the current and % from current price.
5. The ability to remove quote details or add that information to an area below the graph.
Thank you
Hello Steven, we appreciate your suggestions. They have been passed along to the appropriate team.
Can you get the performance profile with the return/risk, and profit probability on the Desktop version?
Hello, thank you for reaching out. You can access the Performance Profile on the right-hand side of the screen underneath your order ticket. Depending upon the nature of the combination and number of legs involved, the data displays max loss, max profit and associated breakeven prices.
We hope this helps!
It would be great to be able to modify cost assumptions. Maybe we don’t want to enter at bid/ask and would like to see performance on a specific entry price even tho the market isn’t there yet. Thanks.
Hello, thank you for reaching out and we apologize for the delayed response. The Option Strategy Lab is a tool within TWS that allows you to enter your price or volatility forecasts for an underlying and it will return a list of single and complex option strategies that will potentially profit based on the forecast entered. Please view this FAQ for instructions to open the Option Strategy Lab: https://www.ibkr.com/faq?id=60330344
Also, the Probability Lab in TWS allows you to customize the Probability distribution based on your price or volatility forecast for the underlying ticker. You can analyze and trade any of the option combinations suggested from your probability distribution. For instructions to open the tool, please check out this FAQ: https://www.ibkr.com/faq?id=60330477
Hi,
I’ve 2 queries; (1) how do i view a purchased option’s breakeven price on Desktop; (2) how do I see live prices of the same option?
Hi Al, thank you for reaching out. You can view a purchased option’s breakeven price on IBKR Desktop using the Performance Profile. Please view this IBKR Campus course for instructions to view the breakeven price: https://www.interactivebrokers.com/campus/trading-lessons/performance-profile-for-options-2/
To view other market data, please subscribe to the necessary market data subscriptions: https://spr.ly/IBKRMarketDataCampus
We have a market data assistant available to help you find data suited to your needs:
https://ndcdyn.interactivebrokers.com/sso/Login?action=CS_MARKET_DATA_ASSISTANT
We hope this helps!
Hi, I tried several box spread combinations, none of which displayed a constant P&L graph. Did I miss anything?
Thank you for reaching out. We cannot replicate this issue. Please try again, and if you continue to experience difficulties, please contact Client Services via live chat or phone call: https://spr.ly/IBKR_ClientServicesCampus
Hi, I used risk navigator on ibkr workstation for analysing option trades. I realized the performance profile for the same option trades have different p&l values for the same trade. Which one is accurate?
Thank you for reaching out. The Risk Navigator is a real-time market-risk management platform that provides a comprehensive measure of risk exposure across multiple asset classes around the globe. https://www.interactivebrokers.com/en/trading/risk-navigator.php
The Performance Profile allows you to toggle the Mosaic Portfolio window into “what-if” mode and add or remove hypothetical positions to and from your existing portfolio to see how these changes will affect key portfolio metrics, including P&L, Delta and the Greeks and Value at Risk. You can read more about the tool here: https://www.ibkrguides.com/traderworkstation/portfolio-performance-profile.htm
If you continue to experience difficulties, please create a detailed web ticket: https://spr.ly/IBKR_ClientServicesCampus
I am encountering an issue on the TWS platform from IBKR with the “Performance Profile” tool. When I try to view the risk profile for an option strategy involving two different expiration dates, a message appears in the “quote details” instead of displaying the risk parameters. The message reads: “P&L numbers and solid line chart (payoff profile) are computed as of the earliest expiration date 15 Nov 24. After nearest date leg expires, you might be exposed to losses exceeding project Max Loss. For multi-expiry combinations, Performance Profile values may vary within a potentially wide range that is not reflected by the clean lines in a graph. In extreme cases, driven by the volatility of its later expiring legs, this may result in flipping of the sign (from + to -) changing what appears to be a potential profit to an actual loss.” I would like to understand why the risk profile does not appear and if there is a solution or adjustment to correctly visualize the risk parameters ?
Thank you for reaching out and we apologize for the delayed response. We cannot replicate this issue. Please create a web ticket if the issue persists: https://spr.ly/IBKR_ClientServicesCampus
Hi, I feel confused about the dotted line. Because when you set the date to be exactly the expiration day, there is still a gap between dotted line and solid line, but they should theoretically be the same? Why the dotted line is a curve instead of having an angle?
Thank you for reaching out. The Performance Profile is available for stock and options for you to consider potential profit and loss values through and at expiration. The chart displays a solid line for at expiration values and a dotted line depicting p/l using the as-of date determined using the date selector.
You can change the percentage of the underlying and change in time in the “Scenarios” option. This changes where the dotted and solid lines are, since the performance profile is based on theoretical values. We hope this information is helpful!
Hi, due to options valuation is also based on interest rates I would like to know (a) which interest rate is used generally (fed funds rate? Libor?) and (b) which interest rate is used according to the option’s expiration? Thank You in advance
Thank you for asking. Interactive Brokers’ interest rates are based on the benchmark rates for each currency and may change daily. These benchmarks use a combination of internationally recognized reference rates (such Fed Funds), bank deposit rates, and dynamic interbank rates determined from foreign exchange and money markets to calculate an IBKR Reference Benchmark rate. https://www.interactivebrokers.com/faq?id=654610290
We hope this information is helpful!
I am looking at a box spread option and I’m not sure why some numbers are different. For example, in one case, in the performance profile, the max profit is -248 and the max loss is 248, which in itself is fine, but in the scenarios P&L window below the P&L is constant at -1332.50. Shouldn’t the max loss and profit also be -1332.50? How are these numbers related?
Thank you for commenting, Martin. For a question related to account or trading data, please create a detailed web ticket for Client Services to review: https://spr.ly/IBKR_TicketCampus
Hello, is it possible to see this performance analysis for a limit order at the specified limit price (i.e. the actual intended trade)? That would be a lot more useful than an analysis at ask price. I think JP also asked this above but the answer didn’t seem relevant (answers a different question).
Hello, thank you for reaching out. No, this is not possible at this time. The Performance Profile only uses the market price and cannot be set to a custom value. We have passed this feedback to the appropriate team.In the future, if you have any specific suggestions, please submit them using the instructions in this FAQ: https://www.ibkr.com/faq?id=32653353
Is it possible to keep the performance profile window tagged to a template? Right now you have to constantly add it as a new window whenever you restart the app. There doesn’t seem to be an option to add it as a permanent window to a template.
Hi, thank you for asking. In IBKR Desktop, it is possible to save the Performance Profile as part of a custom layout. In Layouts, click the plus button and select custom layout. Then you can click Performance Profile and add it to the layout. The layouts should automatically save. We hope this helps!
I’m trying to see the performance profile for a short bear call spread, entered in TWS as a bull call spread that I will sell. The performance profile seems to show the profile of the bull call. How can I ‘reverse’ this to show a bear call? I Iike entering the trade as a short bull call so it keeps the long/short consistent with the trade. I’m short delta, so selling a bull call is easier to comprehend on the screen than buying a bear call.
Hello, thank you for reaching out. To view the correct performance profile, select the strikes and sides for the trade you intend to execute. The chart will automatically display the profile for that combination. The naming (e.g., “bull call” or “bear call”) is based on the selection, but remember that a short bull call and a long bear call represent the same position. Focus on choosing the correct strikes and sides rather than the label, and the performance profile will reflect your intended trade. We hope this helps!
for some reason, i can only view the chart in the performance profile once. If i change the expiry date, then the chart will be missing.
Hello, thank you for reaching out. After logging in, click Trade and enter your desired ticker. Then create the order and click “Attach Orders”. Then you can configure the trailing amount and trailing type. We hope this information is helpful!
Hi, are the commissions considered when calculating the p&l?
Hi, thank you for asking. To take a closer look at how profit and loss is calculated, please view this FAQ: https://www.interactivebrokers.com/faq?id=86690221
We hope this helps!
Hello, I can`t see The Performance Profile on the DESKTOP platform, please let me know where it is. Thanks
Hi, thank you for asking. After logging in, please navigate to layouts on the left hand side of the screen. Then click the second most icon in the right-hand corner to open the Custom Layout Tool Box. Then click Performance Profile. We hope this helps!