There are many option-related data points in IB’s Trader Workstation or TWS, which is a really helpful feature when it comes to monitoring option activity. Many traders like to watch for changes in implied volatility, option volume or open interest to gauge prospects for stock prices.
In Mosaic use the monitor panel to build a new scanner. Click on the double arrowhead and choose Mosaic Market Scanner. Before we build a new scan, let’s look at a few samples saved here in my Library.
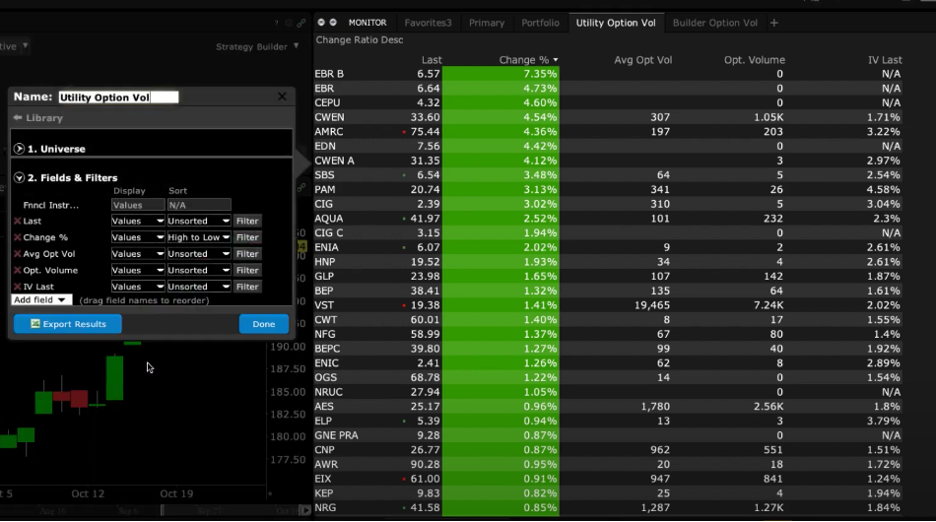
For example: this one displays option volume for stocks in the utility sector. This scanner sorts the universe by percentage change on the day and lists implied volatility. The ranking also allows the user to compare daily option volume against a reading of average option volume over time.

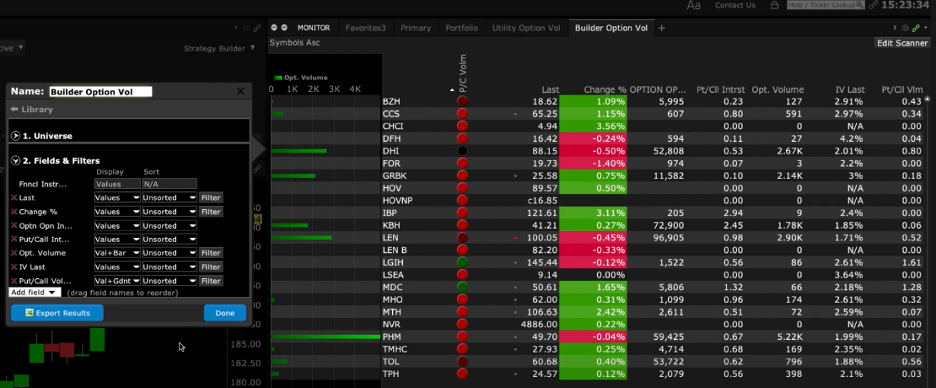
And this one was created to look for option volume among the residential and commercial building industry across several US exchanges. The universe is ranked by Option Open Interest – the number of open positions in the name – while displaying the ratio of put-to-call open interest, option volume and the latest implied volatility reading. Notice also that this scan incorporates a graphical display of current session option volume and implied volatility. This may make it easier to spot heavy volume or stand out levels of volatility.

Mosaic also offers several predefined scanners – for example, High Option Volume …or relatively high implied volatility (IV) versus historical volatility (HV).
To create a market scanner of your own, click on the double arrowhead and again choose Mosaic Market Scanner. Under My Scanners select Create new custom scan and give it a unique name. To build an option scan, select Stock. I will use US and narrow the list of exchanges to just the NYSE for this example. I will use All Sectors, but do note that you may use the Filter by Industry to include or exclude relevant data.
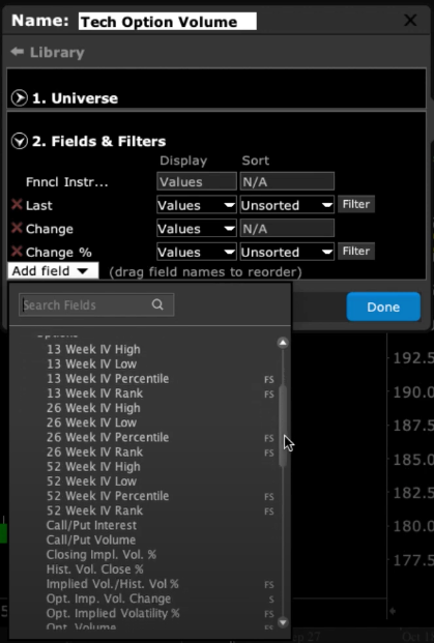
Next, click on the Fields & Filters button to determine what the scanner will display per company. To get to relevant options information, click on the Add field dropdown menu and locate options and click the expand menu. Use the scroll to the right to review the menu items.

Review and select from the list of available items and you will note there are two notations – F for filter and S for sort. These denote how the information may be displayed or ranked in your scanner. Hover over a field to learn more.
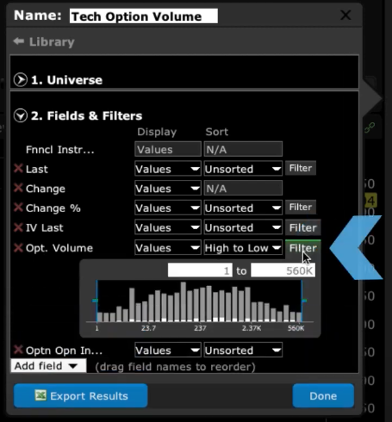
Click Done when you have made your selections. Next, determine which column to sort by. Here I will use Option Volume and rank from High to Low. Note that if you use the Filter to the right, you will be able to determine thresholds for minimum and maximum option volume – or alternative filters if you choose.
Notice how the default view in the Display column reads Values. If I select IV Last, for example, and select Line from the list, see how the information is now graphically displayed rather than simply its reading. Selecting Values & Line will keep the reading for IV displayed on screen. Select Value and Bar for options volume to add this view to the display. For Put/Call volume, try Value and Gradient – hover over any button in the ranking to find the ratio of put-to-call option volume.

You can create and save as many custom scanners as you wish and figure out exactly what display method is most appealing to meet your needs.


How to create custom symbol list to scan
Hello, thank you for reaching out. You can “start from scratch” to create a custom TWS Mosaic Market Scanner. Please review this FAQ article for more information: https://www.ibkr.com/faq?id=103815827/. You can also create a custom watchlist at any time by following these steps: https://www.ibkr.com/faq?id=103814693. We hope this answers your question.
Thanks for the Reply Pls clarify how i can create a symbol list for scanning option volume and open interest for NSE india stocks which are in Futures and options segment
Hello again. Please review this detailed how-to article from our user guide to create an Advanced Market Scanner in TWS: https://www.ibkrguides.com/tws/usersguidebook/technicalanalytics/create%20a%20market%20scanner.htm. You can define a region and create scanner parameters such as option volume and open interest (https://www.ibkrguides.com/tws/usersguidebook/technicalanalytics/market%20scanner%20types.htm).
Hi! Is there a way to create a watchlist that lists most active option strike per underlying? So instead of seeing stock/ETF’s with most active volumes listed you would see which option contracts within a stock/ETF are most active (so for example SPY Aug 30th 440c highest # volume followed by 435 strike or something.)
Thanks
Hi John, please check out our available market scanners in our user guide: https://www.ibkrguides.com/tws/usersguidebook/technicalanalytics/market%20scanner%20types.htm. If you have an account with us, you can ask for the availability of this specific type of market scanner in a web ticket: http://spr.ly/IBKR_CreateWebTicket
How do we scan for underlyings stocks that have upcoming earnings and to exclude them from the scanner?
Hello Zhigui, thank you for reaching out. You can create a custom TWS Mosaic Market scanner by following these steps: https://www.ibkr.com/faq?id=103814693. If this does not help you can ask for the availability of this specific type of market scanner in a web ticket: http://spr.ly/IBKR_CreateWebTicket. We hope this answers your question!
Subject: How to Filter Option Chain by Delta and IV Range in TWS? Hello IB Team, I’m looking to customize the option chain display to view only specific sections for one or more instruments. Specifically, I’d like to filter the chain to show only calls and puts with bid/ask/last prices within a certain delta and implied volatility (IV) range. I haven’t found a way to apply these filters in the standard option chain. Could you please advise if it’s possible to achieve this level of filtering, perhaps through the scanner or another method? Thank you in advance for your assistance! Pierre
Thank you for asking. In the Option Chain, it is possible to filter for Delta and Implied Volatility using the Strategy Builder. After toggling the Strategy Builder on, click on the Settings icon at the top of the Option Scanner. Then navigate to Options Chain> Layout. Then you can add Implied Volatility and Delta columns o the Options Chain. For more information, please review this FAQ: https://www.interactivebrokers.com/faq?id=59342208
We hope this helps!