The IBKR Probability Lab is a Trading Tool to help explain the current relationship between the price of a stock and options traded on it. Usually, the Market Price of a stock and the Implied Prices derived through the options market are very close.
Therefore, the option market tends to be in agreement with the cash value of a stock. In other words, there is no likelihood of a profit at prevailing option prices in the event the stock’s price stands still because the two markets are usually aligned.
The IBKR Probability Lab becomes extremely useful when investors have a different view on the outlook for a stock. By customizing the forward price or the level of implied volatility you will find that the value of options in the market will change. In short, the Probability Lab can be used to locate potentially profitable trading strategies for stocks and options in the event that your view on a stock is different from that of the market.
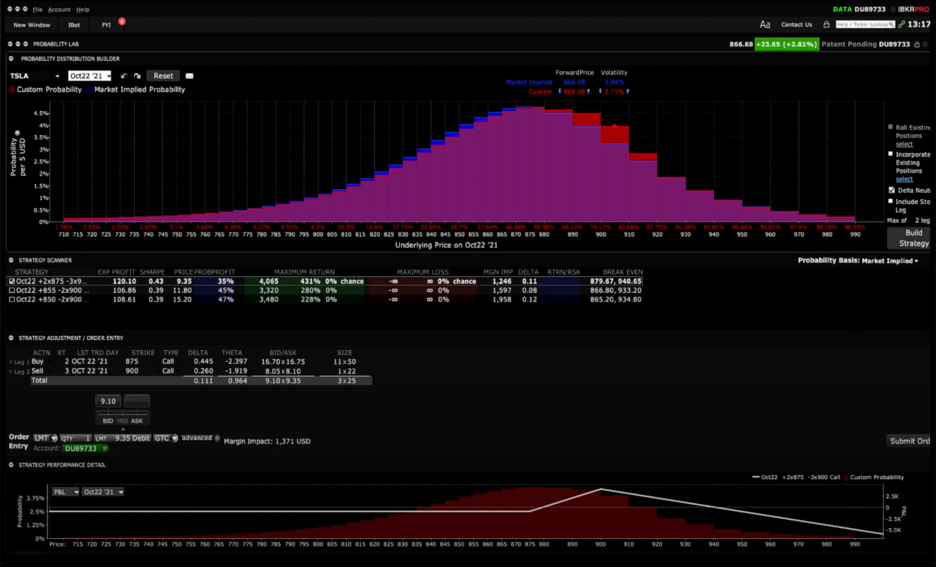
Access New Window button, select Option Analysis and then Probability Lab.
In the Probability Distribution Builder enter any US stock symbol in the Ticker field. Then from the Expiry Selection field choose a suitable time horizon to see the bell curve distribution displayed in the plot. This describes the option market’s prevailing prediction for the price of the stock at the chosen expiration date. It tells us the likelihood that a share price will land within a specific price range by the end of the life of the option used.
Let’s examine how we can overlay your price expectations by customizing the plot. And then figure out a strategy. And then compare the probability of success under both market and your scenario.
Let’s explain what the probability distribution profile is telling us. The profile displays the current thinking on where the price of the underlying will be at expiration. Each bar displays the probability that the share price will be within a specific range, as predicted by the current pricing of the options market.
Let’s compare two expirations for a stock using an option with minimal days to expiration and one with 70 days to expiration.
70 Days to Expiration
The longer the time period used for estimation, the wider is the expected price range. Typically, the Probability Distribution will be greater. Across the bottom you can measure the price range and along the side is the option market’s current implied probability concerning the share price landing at any given price.
Notice how wide the price range is for this stock and see the associated implied probability. Over a 70-day period, the market assigns an approximate probability that the share price will remain unchanged by the time the option contract expires.
In short, the Probability Distribution visually depicts the chance that the stock will lie within a specific price range at a certain time derived from live option market data.
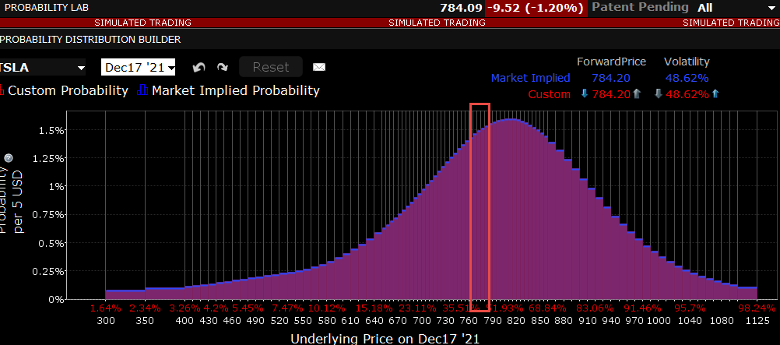
Minimal Days to Expiration
As time passes, the possible distribution shrinks. In this chart you can see that there are far fewer price points since the option expires soon.
And you should also notice that the probability of settling within the highlighted bar is now approximately 20.
Note also the potential price range at which the stock could settle has massively shrunk. In other words, the option market is assigning zero probability to price below $755 and above $810. One hundred percent of possible outcomes now lie within that range.

Hover your cursor above any bar to view the market implied and customized probability of price landing in the specified price range.
Use the Custom Scenario to make your own forecast. There are two ways to adjust the Probability Distribution. Use the up or down arrows on the Custom line to change the terminal value for the stock at option expiration.
Alternatively, use the up and down arrows to change the implied volatility reading for the stock in the same way. Doing so changes the shape of the bell curve or Probability Distribution.
By adjusting the probability of an outcome, the software will identify potential stock and option strategies that could be profitable in the event that your predictions are correct.
For example, you might believe that shares in XYZ will rise by 20% through expiration or that implied volatility associated with a stock will halve by the time the contract has matured. The Probability Lab will compute and rank by risk potential strategies that show the chance of profitability under your predicted scenario and under current market conditions.
Don’t forget that Wall Street analysts typically have 12-month price targets for most companies, which you could use to test for opportunities in the market for stock options.
Alternatively, click and drag a single bar higher or lower at your price prediction.
When you want to start over, click the reset button and begin again.
When ready, look to the right of the plot. Here you can click a button to build strategies. You may select up to four options legs, but for this example I will request just two option legs. There are additional checkboxes that I will leave blank here.
However, you can ask TWS to consider an option strategy that incorporates a custom scenario in conjunction with your current position in a stock. You could also check the box to create a delta neutral strategy, or you could ask to add a stock leg to the position.
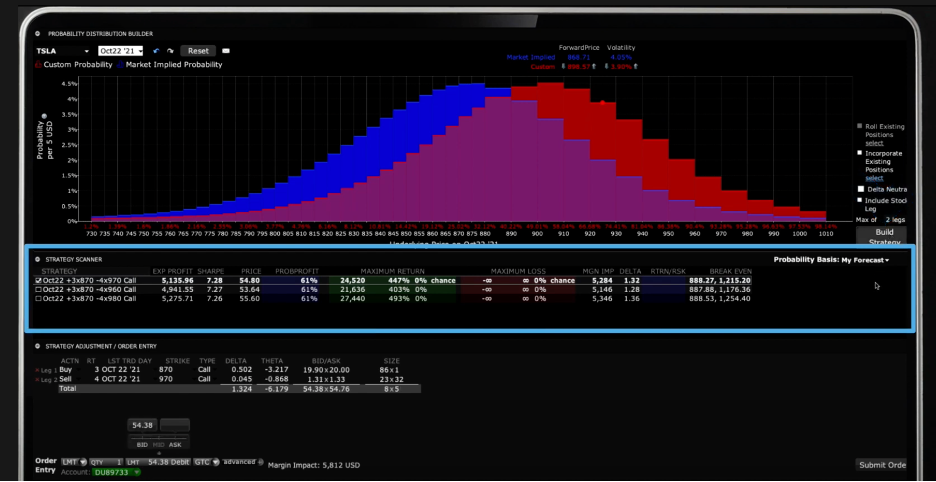
Click Build Strategy. The Probability Lab will populate suggested strategies in the Strategy Scanner panel.
The Strategy Scanner panel lists system-generated stock and option strategies and allows users to compare market versus customized probabilities. Here you can view the potential maximum returns and losses associated with each strategy and see the impact on account margin. You will also see breakeven values associated with individual strategies. Please note that the breakeven values do not take any commissions into consideration.
Probability Basis – The strategy with the greatest potential will have a white check mark to its left. With the Probability Basis dropdown menu set to Market Implied in the Strategy Scanner, look at the column marked Probability of Profit. This tells you the chance of making money from the returned option scenarios under current market conditions.
However, the custom scenario allows for a gain of the value of the underlying through expiration. Change the Probability Basis to My Forecast and check the Probability of Profit field. Under this scenario the chance of profit is higher. The reason is that options are more valuable at the higher prices built into the Custom Scenario. That’s why the Probability Lab is a powerful tool for enabling you to search for potentially profitable opportunities to suit your views.
Strategy Adjustment Area – Since only one strategy can be displayed in the below Strategy Adjustment Area, the one with the white check box is designed to populate here and is also color-coded in the Strategy Performance Detail beneath.
Note that various input fields are configurable, such that if you want to change the ratio, expiration date or strike price for one of the returned lines, you can easily do so. You can delete and entire row by clicking the red ‘x’ to the left of each line. Upon review select the appropriate Order Type and price for your trade and click the Submit Order button to transmit.
Strategy Performance Detail – You can compare multiple strategies at once on the Strategy Performance Detail graph.
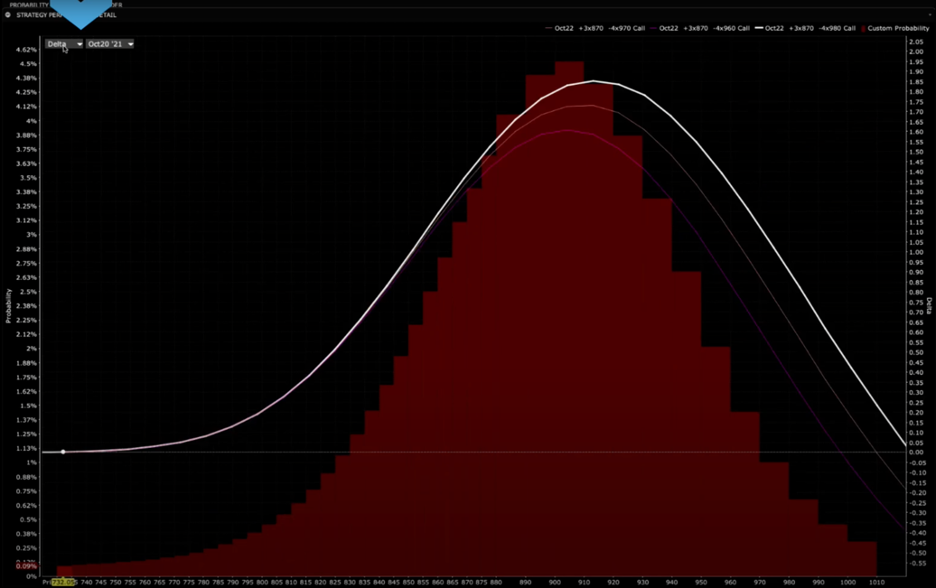
Each strategy is color coded as you check the box to the left in the Strategy Scanner panel. The default view examines the potential P&L at expiration for the chosen strategy, but you can also view the potential P&L on any day through expiration by selecting it from the date dropdown menu. You can also view Delta and other Greek values from the input selector field from this window. Once again this can be shown at any time horizon through expiration.
Please note that multiple leg strategies, including spreads, will incur multiple commission charges, possibly having an effect on trade P&L.









Hi, thanks for the video. I understand that market probabilities are determined solely by the prices of options in the market. Is that correct?
Hello, thank you for reaching out. The probabilities shown in the Probability Lab are calculated using the customized probability distribution you create by modifying the red bars. So they reflect your own price and volatility forecasts for the underlying stock. Please view this FAQ for more instructions to use the Probability Lab: https://www.ibkr.com/faq?id=60330499
We hope this helps!
Hi! Is there somewhere that better describes what exactly determines the strategies being output in the Probability Lab?
It just seems odd that in my testing, I can deliberately input a custom forward price probability of say 60% @ $100 & 40% @ $101, (which is to say there is a 100% chance the underlying will either trade at either of those prices) but when I request the tool to build me a strategy, it throws out odd recommendations with option legs like Long 4x 70 Put.
I can’t seem to understand why that would make sense.
Hello, thank you for asking. Please view this User Guide for more information on the Probability Lab: Probability LabSM (Patent Pending) (ibkrguides.com)
We hope this information is helpful!