Let’s take a quick look at using Option Chains in IBKR Desktop.
Option Chains may be accessed from the Quote window using the Option Chain tab.
Options for the selected underlying stock are displayed and using the Financial Instrument list to the left of the Option Chains tab, the user may quickly switch from stock to stock. Note, when entering a stock into the input field in the upper left corner of IBKR Desktop, user must select Options before hitting Enter, and then choosing the desired stock.
Tabbed and List View
By default option chains are displayed in Tabbed View, where you can see options for different expiration date by clicking the tabs along the top of the table. Use the arrows to the left and right of the expiration line to scroll through different dates. The Tabbed view displays call options on the left of the page and put options to the right with Strike prices shown in the center column.
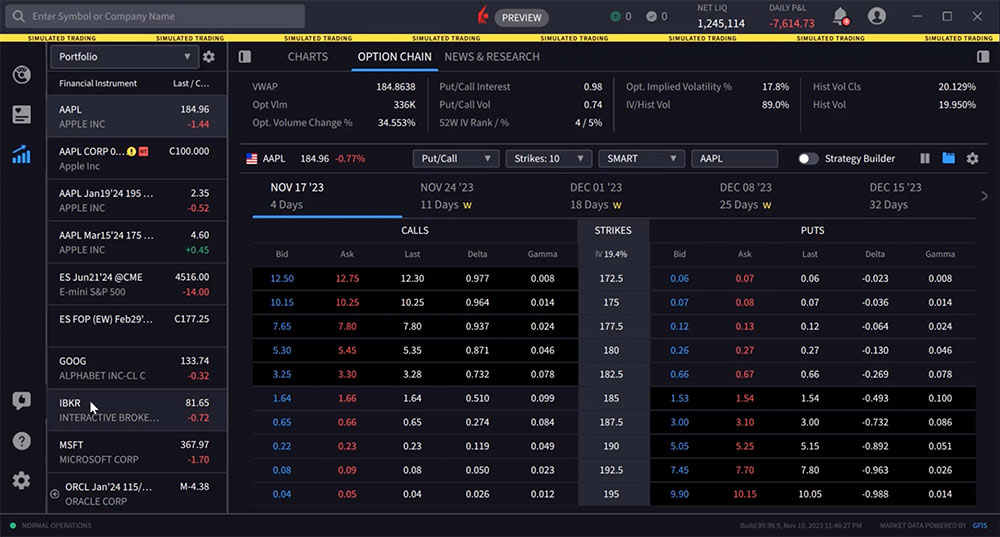
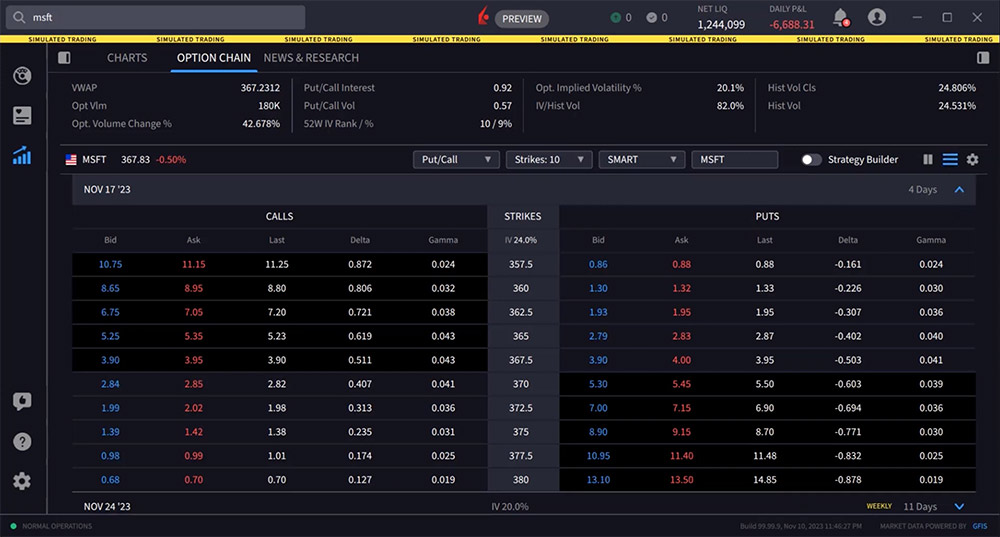
The user may switch to the List view by locating and clicking the icon to the immediate left of the gear icon. In this view the nearby expiration is fully displayed at the top, while further expirations are shown below and labelled in the column to the left of the screen. Use the blue down arrow to the right of each line to expand and contract the active view.
Customizing the Display
Just above the tabs you’ll see the option’s underlying with the current price, and then to the right, some selectors you can use to customize your view.
Choose the put/call display to choose between both types of options or just calls or only puts.
Use the Strikes dropdown to determine the number of strike levels displayed by either absolute number or using standard deviation away from the underlying price.
Use the destination dropdown to route your order to a specific exchange. Note that the default destination is Smart, which is intended to provide the investor with the highest probability of a fill at the lowest overall cost.
Strategy Builder
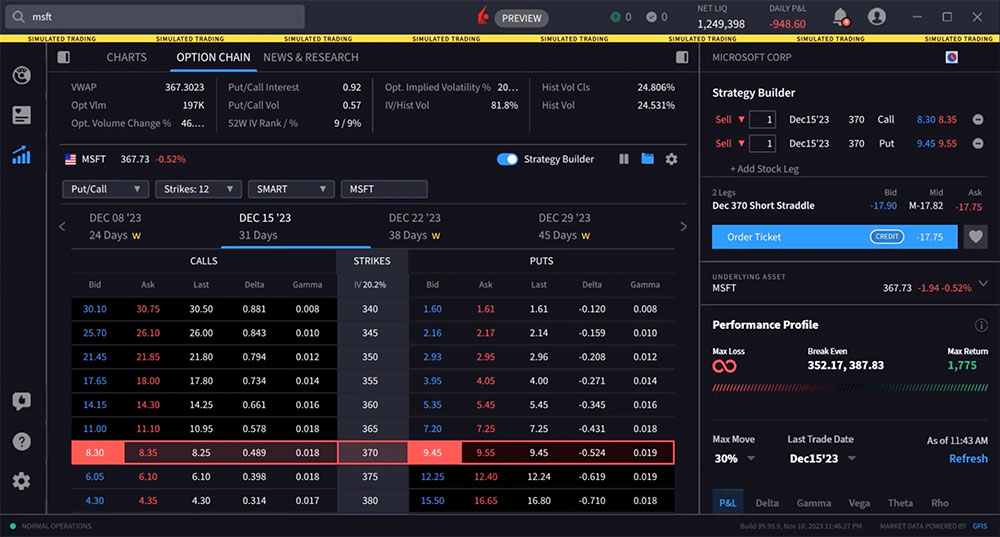
Toggle on the Strategy Builder to build multi-leg option combos. When displayed, the right panel will populate with chosen option legs and name the combination. The panel will provide analytics on the strategy including Performance Profile and Scenario Analysis. Scroll down the panel to view full details. In this example the user builds a short straddle and sees the combo named in the Strategy Builder panel. The user may see Performance Profile and combo break even values below. The user may also quickly convert to a long straddle by reversing direction to the upper right, changing each leg from Sell to Buy. The panel data beneath automatically updates.
Configuring the Display
Use the gear icon to the upper right of the options chain display to configure Call and Put columns. Option Chains allow you to display up to 10 fields. Inside the configuration tool user will see active selected columns to the left and available columns to the right.
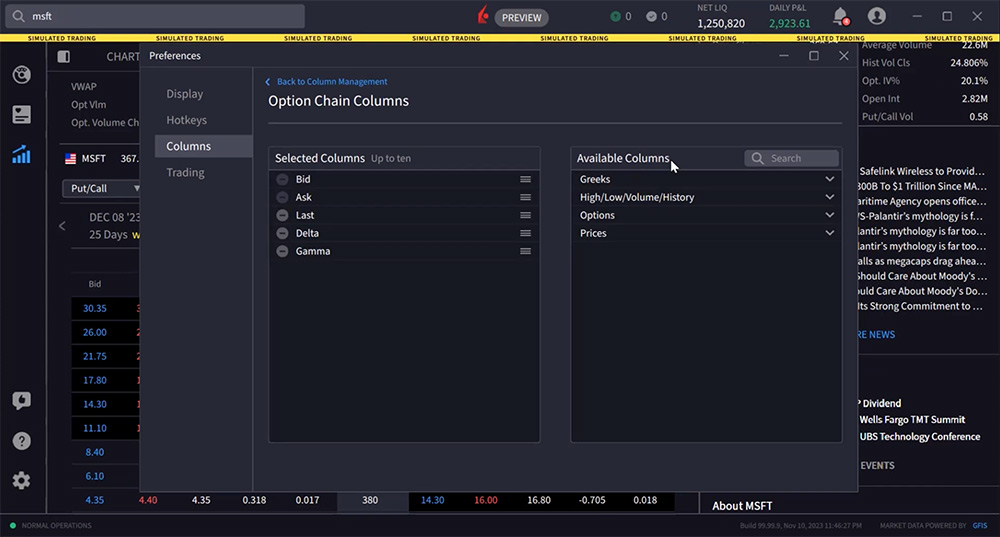
Expand an area and when user clicks an item it will disappear from available and appear on selected columns. To reorder an item, depress and hold the mouse right-click and drag the item to the desired order. Use the minus sign in Selected Columns to remove a field. When you’re done managing Option Chain columns simply close the box and your changes are automatically saved.
Mirror Feature
To the right of the Strategy Builder toggle you’ll see the “mirror” feature where you can choose to mirror columns in the option chain. The standard layout does not have a mirrored view, rather each column displayed on the calls side, duplicates in same order on the puts side. By selecting mirror from the icon user has two choices: Mirror completely, or mirror except the bid/ask columns.
Entering an Order
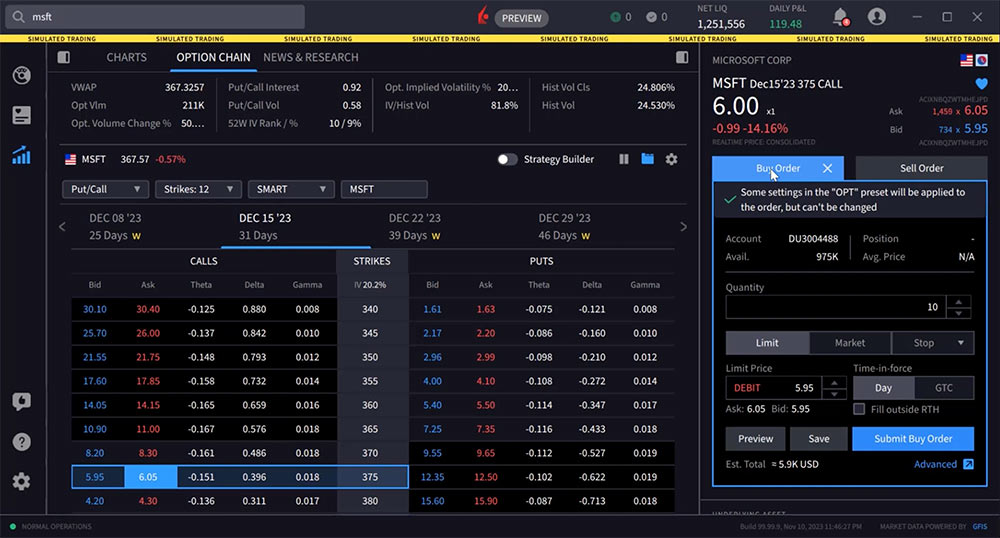
The Option Chain window engages rapid order entry. Hovering above the BID price in the option chain makes a red border appear around the active region.
Hovering above the ASK price in the option chain makes a blue border appear around the active region.
Click the bid price of an option to create a sell order in the Order Entry panel to the right. The order can be switched quickly to a buy order by clicking the Buy Order icon. The order ticket will populate with default quantity, order type and time in force. This can be configured and saved within the Configuration area. The user should take care to adjust quantity and price values as desired before submitting the order by clicking the button.
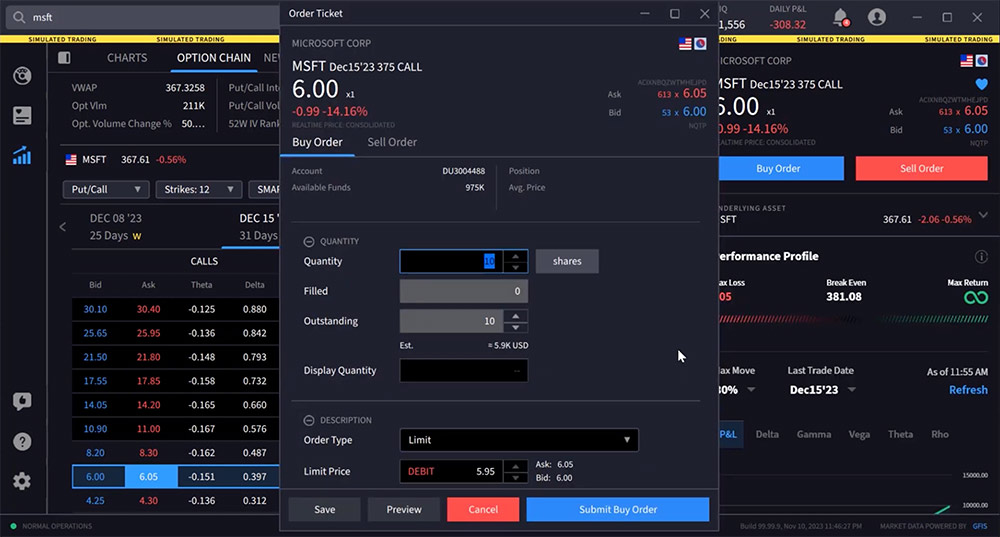
Use the Advance expansion arrow to the lower right of the order ticket to display an expanded view where additional inputs and algos may be available.
Resources


Display of existing positions on the option chain should be a high priority feature
Thank you for sharing. You can submit this feedback in IBKR Desktop (speech bubble with thumbs up icon). Additionally, you can keep up to date on our new releases with the IBKR Desktop release notes:
https://www.interactivebrokers.com/en/education/tradersu/documentation.php
We certainly need better instruction to access and compete Rolling options
Hello, we appreciate your feedback. It has been passed along to the appropriate team. Please check out this course on the Options Rollover Tool: https://www.interactivebrokers.com/campus/trading-lessons/tws-options-write-rollover-tool/
It could be a great resource for you!
how does IBKR calculate Standard Deviation on the Options chain? How can it accessed via IBAPI?
Hello, thank you for reaching out. The standard deviation for the options chain is calculated based on the implied volatility. Specifically:
The implied volatility is estimated for the 8 options on the 4 closest to market strikes in each expiry.
These implied volatilities are fit to a parabola as a function of the strike price for each expiry.
The at-the-market implied volatility for an expiry is the value of the fit parabola at the expected future price.
A linear interpolation (or extrapolation) of the variance is done based on the squares of the at-market volatilities.
The standard deviation is then the square root of this estimated variance.
So in summary, the standard deviation is derived from the implied volatilities of the options prices using a model that fits a curve to the volatilities and interpolates to find the at-the-money volatility.
Standard Deviation values are not passed via TWS API. Users would need to query strikes using reqSecDefOptParams to receive a list of all strikes and then locally calculate the standard deviations.
Please reach back out with any more questions. We are here to help!
Just to be clear, it’s better to have the IV% in the Option Chain view. That way, we know that each row is 1 standard deviation based on it’s IV%, for example, the first row will be the 1 standard deviation price for 27.3% IV. Am I right to say this?
Thank you for reaching out. If you have a specific suggestion(s) on how we can improve, we would like to hear it! Please review this FAQ on where you can leave your feedback:
https://www.ibkr.com/faq?id=32653353
Do I have to pay a subscription for getting the options quotes and being able to negotiate?
Hello, thank you for reaching out and we apologize for the delayed response. Please view this FAQ for instructions to select the correct market data package to see pricing on U.S. stock and index options:
https://www.ibkr.com/faq?id=35797042
Please reach back out with any more questions. We are here to help!
Can I do a conditional order example close or open an option position when underlying share prices reaches a certain price?
Do you have a working python program using TWS API to retrieve the SPX weekly option chain for a specific date?
Thank you for asking. You can review our API Hub for more guidance and examples regarding the options chains: https://www.interactivebrokers.com/campus/ibkr-api-page/twsapi-doc/#option-chain. You can also create a web ticket for this inquiry; we have a category specifically for “API.” One of our API experts will be happy to guide you! https://spr.ly/IBKR_TicketCampus
Do you have a working Python example of getting the options chain for SPX for a particular date and output the call and put bid/ask price and delta at each available strike?
Thank you for asking. You can review our API Hub for more guidance and examples regarding the options chains: https://www.interactivebrokers.com/campus/ibkr-api-page/twsapi-doc/#option-chain. You can also create a web ticket for this inquiry; we have a category specifically for “API.” One of our API experts will be happy to guide you! https://spr.ly/IBKR_TicketCampus
can it be in arabic language
Hello, thank you for reaching out. This is not available at this time. However, we have passed your suggestion to the appropriate team. We appreciate your question!
Can you hide weekly expirations?
Thank you for reaching out. Yes, it is possible to hide weekly expirations on the option chain. In the TABBED VIEW of the Option Chains panel, you can uncheck the box next to “Weeklies/Quarterlies” under the MORE tab to hide weekly expirations. In the LIST VIEW, you can use the Time Period drop-down menu to select different expirations, which allows you to exclude weekly options if desired. We hope this helps!
Hola, me podrian proporcionarme un video instructivo de como invertir en opciones en ESPAÑOL. Gracias
Gracias por comentar. Si vas a la Configuración del video (rueda dentada), luego subtítulos, puedes cambiar el idioma. Es posible que primero tengas que seleccionar inglés, luego volver a la misma configuración y ahora debería haber la opción de traducción automática en una variedad de idiomas. ¡Esperamos que esto ayude!
Sell call expired, how does it desapier if it was not ejecute by the buyer??
Thank you for your question. If you take no action on expiring options, those that are in-the-money (ITM) by a clearinghouse-defined specific amount will automatically be exercised. For example, options traded on US exchanges that are cleared through the Options Clearing Corporation (OCC) will be automatically exercised if they are $0.01 or more ITM, while those trading on Eurex and cleared through Eurex Clearing AG (ECC) must be more than 10 basis points ITM to be automatically exercised. You can read more details here: https://www.interactivebrokers.com/faq?id=335229930
The options Volume and Options Open Interest should be in the same chart displaying Puts in Green on left side and Calls in red colour on right side for the specific selected trading days in the Options Lab. At present the chart for puts is showing in separate chart and calls in separate chart for both OI and Option volume. I can share picture if required to be more specific if not clear. Thanks
How can I do a conditional order for example close or open an option position when underlying share prices reaches a certain price?
Hello Greg, thank you for reaching out. Please view this FAQ for instructions to create a Conditional Order in TWS: https://www.ibkr.com/faq?id=28224878
We hope this helps!
Why i cant see option chain on SPY / QQQ / other ticker from website ? i can see it from my phone
Hello, thank you for reaching out. For instructions to see options chains using Client Portal, please view: https://www.interactivebrokers.com/faq?id=58433717
We hope this helps!