
- Solve real problems with our hands-on interface
- Progress from basic puts and calls to advanced strategies
Interactive Options Course
Lesson 7 of 17
New to Interactive Brokers?
Let’s take a quick look at how you can manage multiple charts using multi-chart mode.
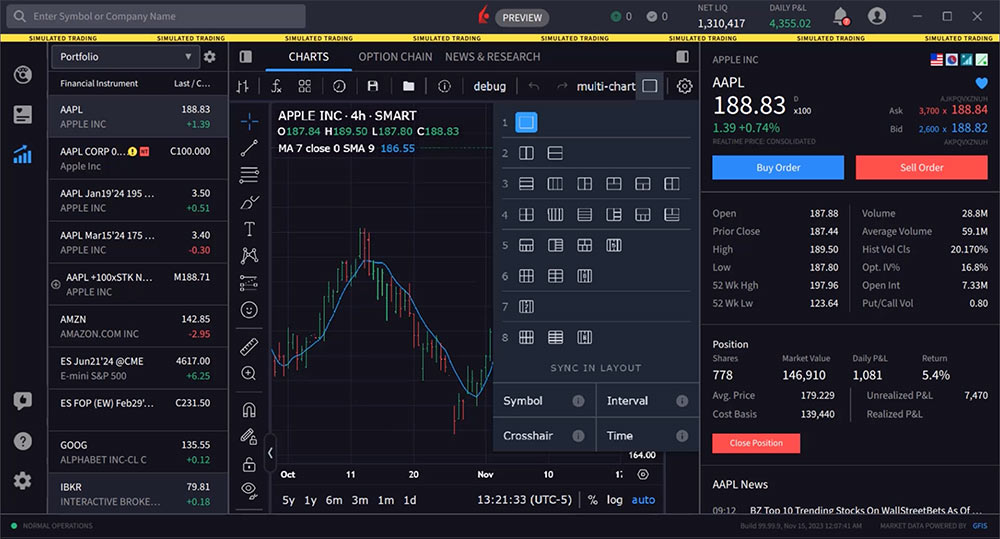
Click the Quote icon in the left-side panel and, if necessary, click the Charts tab above the display. The single chart displays data for the selected instrument.
To view multiple charts the user can click the multi-chart icon above the chart to the right. Inside the multi-chart display are two areas: The first determines the number of charts to be displayed. The user may configure to show up to eight charts. The second area at the bottom of the panel tells the user what chart feature will be replicated between charts. When activated, using a click on each button, the sync feature controls whether symbol, crosshair, interval or time period carries over to each of the charts displayed.
The Sync in Layout tools allow you to view charts for any symbol, or multiple charts for different symbols. It also allows you to sync or separate various other useful functions.
We will illustrate the sync feature using a four-chart display from the Multi-chart panel.
Choose “Symbol” to have symbols synched across all charts in the layout. To compare charts of different companies, de-select Symbol.
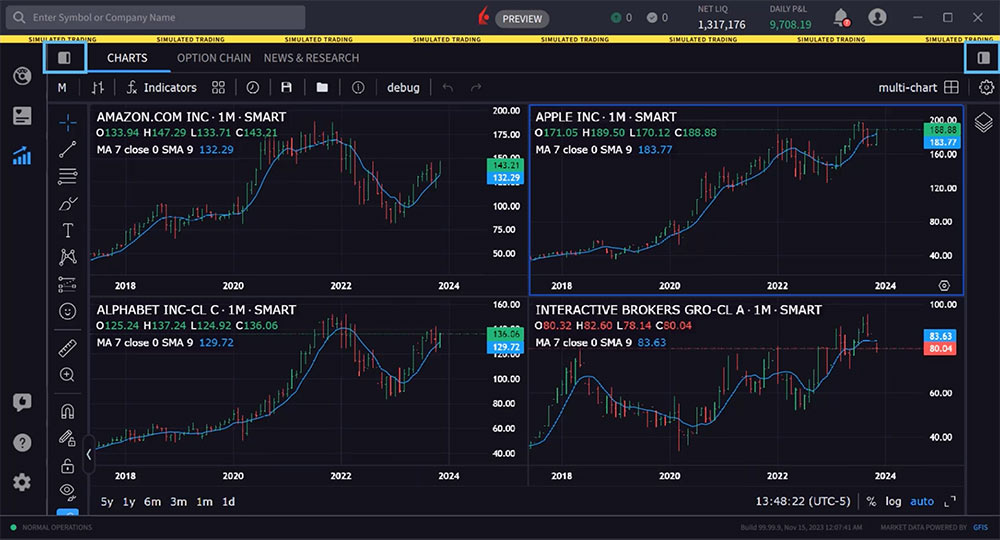
In this example, we will leave Symbol deselected, and close the Multi-chart panel by clicking the icon. Note that clicking a chart makes it the active chart. The active chart is indicated by a blue border. The user can activate each chart by clicking and then selecting a different symbol from the Portfolio tab to the left to see four different charts displayed.
In this case the user selects a different time period for each chart. The user clicks in one of the charts to make it the active display.
In order to view the same symbol the user clicks the Multi-chart icon and clicks Symbol. Now each chart displays the common symbol across different time periods.
Open the Multi-chart panel again and the user clicks on the Interval period to synchronize charts to the active time interval.
Users may elect to sync crosshair, time, and interval so that they can compare different instruments using the same criteria. When you turn on the sync feature, all charts will pick up the synched feature of the selected chart.
Remember that you can increase the size of your chart display by hiding the left and right-side panels. To do this the user simply clicks one or both of the Show/Hide Panel icons in the top left and top right of the chart.
Resources
For specific platform feedback and suggestions, please submit it directly to our team using these instructions.
If you have an account-specific question or concern, please reach out to Client Services.
We encourage you to look through our FAQs before posting. Your question may already be covered!
The analysis in this material is provided for information only and is not and should not be construed as an offer to sell or the solicitation of an offer to buy any security. To the extent that this material discusses general market activity, industry or sector trends or other broad-based economic or political conditions, it should not be construed as research or investment advice. To the extent that it includes references to specific securities, commodities, currencies, or other instruments, those references do not constitute a recommendation by IBKR to buy, sell or hold such investments. This material does not and is not intended to take into account the particular financial conditions, investment objectives or requirements of individual customers. Before acting on this material, you should consider whether it is suitable for your particular circumstances and, as necessary, seek professional advice.
The views and opinions expressed herein are those of the author and do not necessarily reflect the views of Interactive Brokers, its affiliates, or its employees.
Any stock, options or futures symbols displayed are for illustrative purposes only and are not intended to portray recommendations.


very nice. What I would like: 1. Easy scanning filter (technical analysis), 2. Option for CNBC TV window, 3. Sorting tools: dividends, volume, gappers etc. Have a look on ETRADE or Webull, everybody can learn from competitors. Happy days and a good year 2024! Martin 😉
Hello, thank you for reaching out. Your suggestions have been passed along to the appropriate team. If you have any more suggestions about TWS, please send it to twsfeedback@interactivebrokers.com. We appreciate your interest!
How about one chart comparing two symbols?
Hello, thank you for reaching out. This is available TWS regular charts (Comparison or Add Symbol). This is in the queue to be released for Advanced Charts. We hope this helps!
Hello, is there a release date for comparing two symbols on the Advanced Chart in TWS yet? Thanks!
Thank you for asking. There is no release date for TWS yet. However, this feature is now available in IBKR Desktop. We hope this helps!
Is the Multi-Chart Mode available in Client portal or IBKR mobile app ?
Hello Pramod, thank you for asking. At this time, multi-chart mode is only available in IBKR Desktop. Please reach out with any more questions. We are here to help!
Is there a way to open charts in a new window in order to support multiple monitors and desktops, or are you always locked into a single window?
Hello, thank you for reaching out. This feature is in the pipeline but currently has no ETA. In the future, please submit specific suggestions and feedback directly in IBKR Desktop (speech bubble with thumbs-up icon).
Is there a way to lock time period for each chart so that if you move to a different symbol, time scale remains same?
Hello, thank you for reaching out. Unfortunately, there is no way to lock the time period on charts in IBKR’s platforms so that it remains the same when switching between symbols. The time period on each chart is specific to that symbol and will reset when a new symbol is selected. In the future, please submit specific suggestions and feedback directly to our development team: https://www.ibkr.com/faq?id=32653353
When will this be available for TWS?
Hello Brenton, thank you for asking. This is on our roadmap with no ETA at this time. In the future, if you have a specific suggestion(s) on how we can improve, we would like to hear it! Please review this FAQ on where you can leave your feedback: https://www.ibkr.com/faq?id=32653353
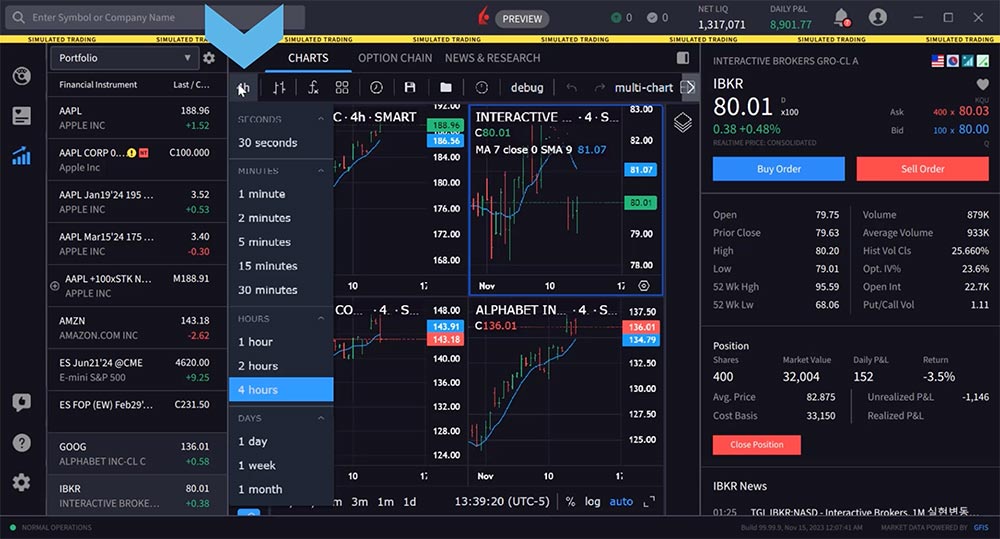
Hi team – how can i select for e.g. the 10/15 seconds timeframe on the charts? (I only have 30secs available as the lowest option possible)
Hi Mous, thank you for reaching out. Please make sure that you are using the newest version of TWS. After making your chart, you can click the button in the top left corner to configure the timeframe. Please view this FAQ for more information on how to change the time period and chart interval for Advanced Charts: https://www.ibkr.com/faq?id=370330516
Please reach back out with any additional questions. We are here to help!
When using the multi-chart feature, how do I unsync the drawings? For example, I want to add parallel lines to a chart but do not want it to be reflected in the other charts. How do I do it?
Hello, thank you for asking. To unsync drawings on multi-chart windows in IBKR Desktop, you need to right-click on the chart and select “Remove drawings”. This will allow you to add drawings like parallel lines to one chart without having it reflected on the other charts in the multi-chart window.
We hope this helps!
This does not seem to work. Drawing on say 4hr window and replicating it to the daily window also.
Thank you for commenting. If the above instructions do not help, please create a detailed web ticket for further guidance: https://spr.ly/IBKR_TicketCampus
I cannot find the multi chart icon, not in my version
have the same problem, been looking for the multi chart to un-sync the symbols
same
Does desktop app provide 10s interval chart?
Hi, thank you for asking. To change the chart type, chart interval, or chart time frame, please view: https://www.ibkrguides.com/ibkrdesktop/charts-intervals-timeframes.htm
We hope this helps!
I did some chart settings, and I want to save it. How can I do it? How can I copy it to another chart? In quote and in layout I have diffferent chart settings, why? How can I make them all the same? Can I find forex tickers?
how do i sync drawings in all layouts? right now i can only sync drawings to a single layout. It’s available on TradingView but on IBKR desktop, it only allows for syncing to 1 layout. i then have to copy the drawings manually to all layouts
Hi, thank you for asking. The only way to sync drawings in Advanced charts is to reload them, e.g. switching to some other ticker and back – and the drawings will update. We hope this helps!