
- Solve real problems with our hands-on interface
- Progress from basic puts and calls to advanced strategies
Interactive Options Course
Lesson 8 of 9
Already an Interactive Brokers Client?
New to Interactive Brokers?
Many options traders begin with a market opinion. Perhaps you’re bullish on Apple (AAPL), expect the stock to remain rangebound, or simply want to generate income from the shares you already own.
The challenge is deciding which options strategy best matches that outlook.
Should you buy calls? Sell puts? Trade a vertical spread? Write covered calls?
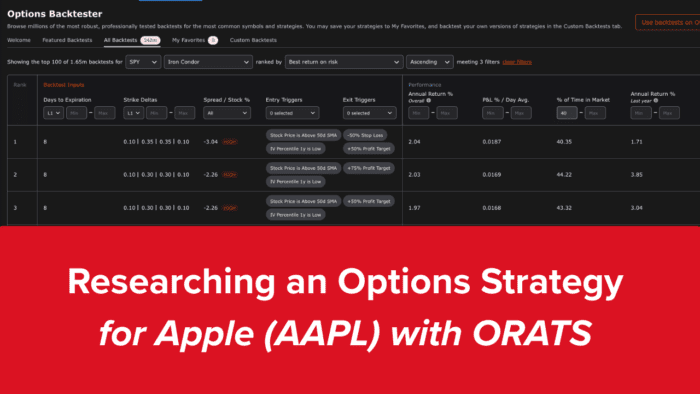
ORATS can help answer those questions by showing how similar strategies have performed historically under comparable conditions. Rather than starting with a strategy and hoping it works, traders can begin with a stock and investigate which approaches have historically delivered attractive risk-adjusted returns. The ORATS Backtester allows users to search, rank and compare large numbers of historical strategy tests across popular underlyings. [interactiv…rokers.com], [orats.com]
From the ORATS Backtester, navigate to the All Backtests page.
The search and filter tools allow you to narrow results to a specific underlying symbol. Enter:
Symbol: AAPL
The results now display historical tests specific to Apple options rather than the broader universe of available symbols. The All Backtests page allows traders to filter by symbol, strategy type and ranking criteria. [interactiv…rokers.com]
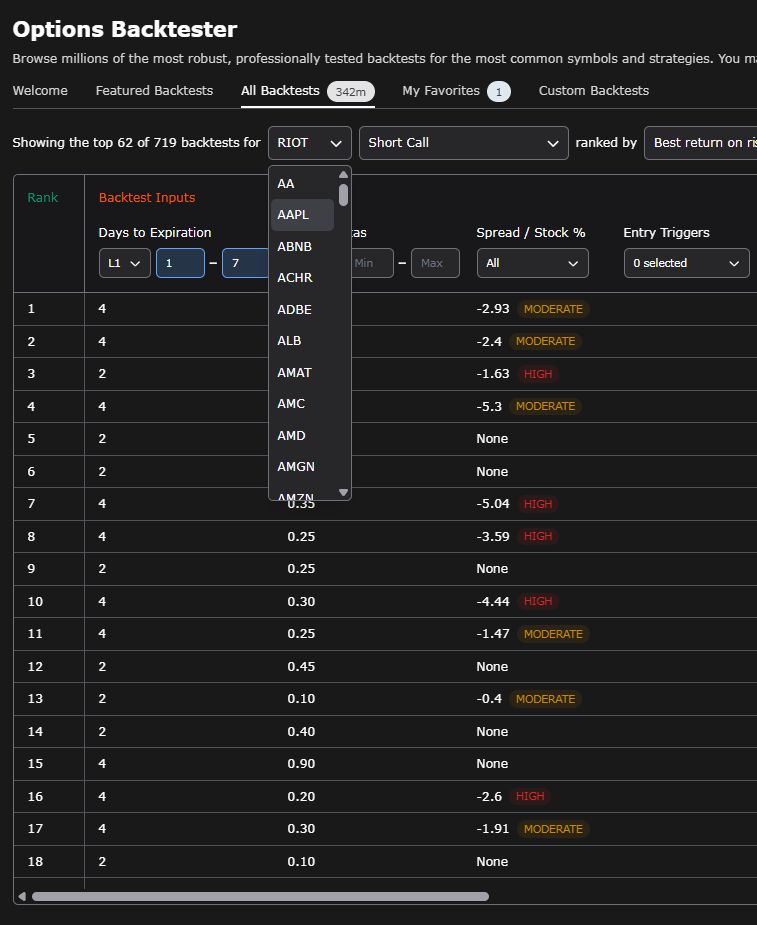
Apple traders may find dozens or even hundreds of historical strategy variations.
To simplify the process, begin with a familiar strategy category:
At this stage, don’t worry about finding the “perfect” trade.
Instead, focus on understanding how each strategy behaves differently.
For example:
Covered Calls
Cash-Secured Puts
Bull Put Spreads
One of ORATS’ most useful features is the ability to rank strategies using different performance measures. The system enables traders to sort and compare historical results using various performance metrics. [interactiv…rokers.com], [orats.com]
Popular ranking criteria may include:
A strategy producing the highest return may not necessarily be the best choice if it also experienced substantial losses along the way.
This is where ORATS helps traders move beyond headline performance numbers.
After selecting a backtest, click the row to open the detailed report.
Several views become available, including:
These views allow traders to understand not only what happened but how the results were achieved. [interactiv…rokers.com]
When viewing the equity curve, ask yourself:
Consistency is often as important as profitability.
Suppose your research identifies three potentially attractive Apple strategies:
Rather than selecting one immediately, compare:
An investor seeking monthly income might favor one strategy, while a trader seeking capital efficiency may prefer another.
The goal is not to copy historical results but to understand how different strategic choices influenced outcomes.
ORATS is most effective when used as a comparison tool.
Instead of asking, “What should I trade?”
Ask:
“Historically, how have different Apple options strategies behaved, and which one best matches my objectives and risk tolerance?”
That shift in thinking can turn ideas into a more structured research process.
Using AAPL:
One Filter Can Change Everything
When new users first encounter ORATS, one setting immediately stands out:
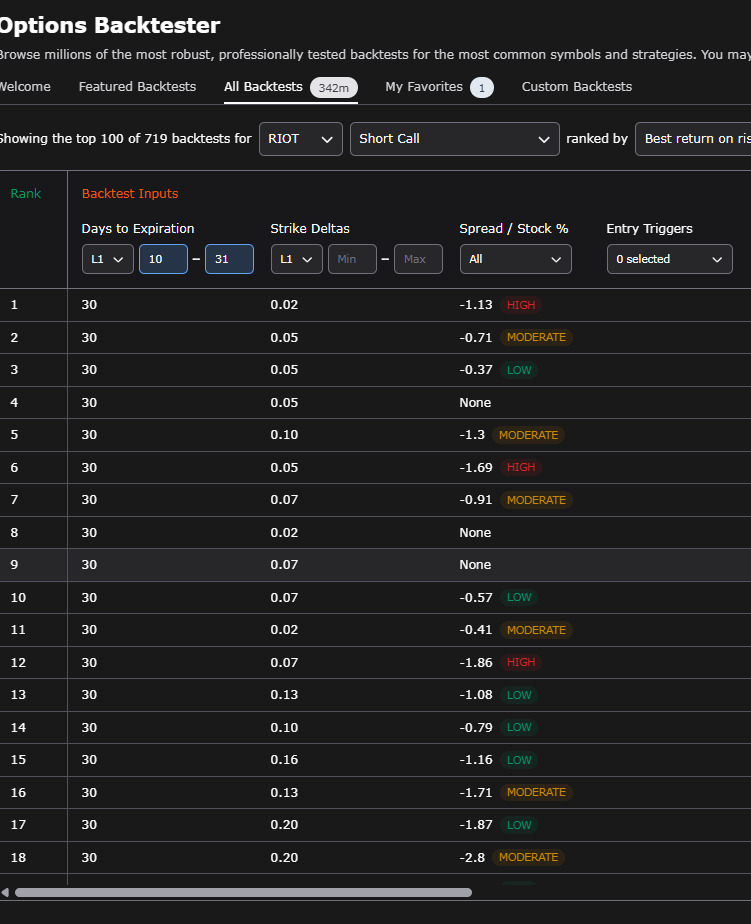
Days to Expiration (DTE).
Depending on the strategy, you might find historical tests using:
A common question is:
Why would one trader select 45 days while another chooses 250?
The answer lies in the trade-off between risk, time, and opportunity.
Days to Expiration simply represents how many days remain before the option contract expires.
For example:
The selected expiration influences:
As a result, DTE is often one of the most important factors affecting strategy performance.
Strategies using shorter expirations frequently experience faster time decay.
Potential benefits include:
Potential drawbacks include:
Many traders are attracted to short-dated options because results are realized quickly.
Many experienced premium sellers often focus on expirations between approximately 30 and 60 days.
Why?
Because these expiration cycles may offer an attractive balance between:
This explains why you may encounter numerous ORATS strategies using 45 DTE settings.
It isn’t necessarily the “best” expiration. Instead, it represents a middle ground that many traders use as a starting point for research.
Longer-dated options may remain open for months.
Potential benefits include:
Potential drawbacks include:
Longer expirations are commonly associated with LEAPS-style strategies and longer-term investment themes.
One powerful ORATS workflow is to hold everything constant except expiration.
For example:
Assume you are researching a bull put spread on AAPL.
Run similar historical searches using:
Now compare:
The results may reveal meaningful differences despite using the same underlying stock and strategy structure.
Many traders spend considerable time debating strike selection but overlook expiration choices.
Yet changing from 30 DTE to 60 DTE may alter the historical performance characteristics of a strategy dramatically.
ORATS allows traders to test these assumptions with data rather than relying on rules of thumb.
Try It Yourself
Using your preferred underlying:
Next, we’ll explore another critical decision: choosing strike prices.
The analysis in this material is provided for information only and is not and should not be construed as an offer to sell or the solicitation of an offer to buy any security. To the extent that this material discusses general market activity, industry or sector trends or other broad-based economic or political conditions, it should not be construed as research or investment advice. To the extent that it includes references to specific securities, commodities, currencies, or other instruments, those references do not constitute a recommendation by IBKR to buy, sell or hold such investments. This material does not and is not intended to take into account the particular financial conditions, investment objectives or requirements of individual customers. Before acting on this material, you should consider whether it is suitable for your particular circumstances and, as necessary, seek professional advice.
The views and opinions expressed herein are those of the author and do not necessarily reflect the views of Interactive Brokers, its affiliates, or its employees.
Options involve risk and are not suitable for all investors. For information on the uses and risks of options, you can obtain a copy of the Options Clearing Corporation risk disclosure document titled Characteristics and Risks of Standardized Options by going to the following link ibkr.com/occ. Multiple leg strategies, including spreads, will incur multiple transaction costs.
The analysis in this material is provided for information only and is not and should not be construed as an offer to sell or the solicitation of an offer to buy any security. To the extent that this material discusses general market activity, industry or sector trends or other broad-based economic or political conditions, it should not be construed as research or investment advice. To the extent that it includes references to specific securities, commodities, currencies, or other instruments, those references do not constitute a recommendation by IBKR to buy, sell or hold such investments. This material does not and is not intended to take into account the particular financial conditions, investment objectives or requirements of individual customers. Before acting on this material, you should consider whether it is suitable for your particular circumstances and, as necessary, seek professional advice. The views and opinions expressed herein are those of the author and do not necessarily reflect the views of Interactive Brokers, its affiliates, or its employees.











Join The Conversation
For specific platform feedback and suggestions, please submit it directly to our team using these instructions.
If you have an account-specific question or concern, please reach out to Client Services.
We encourage you to look through our FAQs before posting. Your question may already be covered!