
- Solve real problems with our hands-on interface
- Progress from basic puts and calls to advanced strategies
Interactive Options Course

Posted March 10, 2025 at 11:39 am
1/ 200-Day Moving Average
2/ Inflation Data
3/ Government Shutdown
Investopedia is partnering with CMT Association on this newsletter. The contents of this newsletter are for informational and educational purposes only, however, and do not constitute investing advice. The guest authors, which may sell research to investors, and may trade or hold positions in securities mentioned herein do not represent the views of CMT Association or Investopedia. Please consult a financial advisor for investment recommendations and services.
200-Day Moving Average
We have been preaching to investors that they may want buckle-up for weeks now and that may have been an understatement.
Another week of tariff indecision continued to add to intraday swings that only an amusement park aficionado could appreciate. If you turned your back on your trading screens you may have missed a big move. I discussed the recent volatility here with CNBC’s Power Lunch.
This week could provide more drama thanks to uncertainty out of Washington as there is a possible government shutdown on the horizon as well. The only thing traders know for certain is price.
What did price action do last week?
It fell to a key level that was the talk of the financial media. Let’s review that and the other topics as seen from the floor.
The 200-Day Moving Average. The Nasdaq and the Nasdaq 100 both hit official correction territory – meaning they sold off 10% from their peaks. The S&P 500 hasn’t quite hit that threshold but it did fall to a very key technical level. It briefly dropped below its 200-day moving average for the first time since October 2023. A late Friday rally helped the index close above the average.
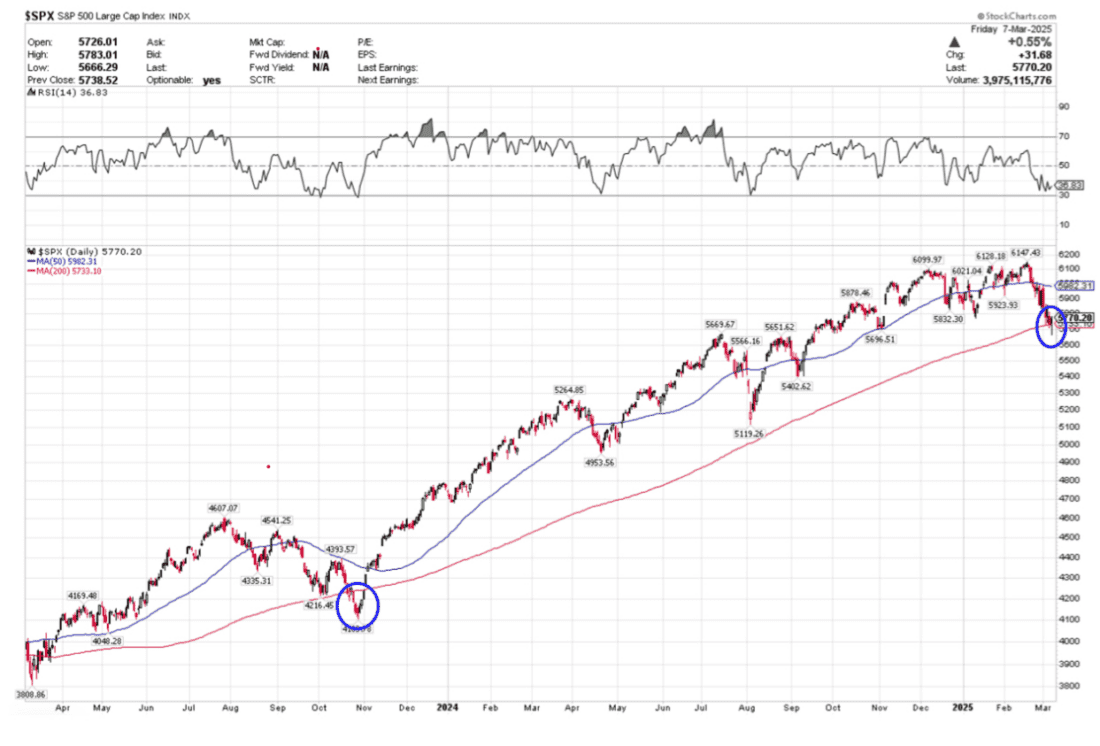
The last time it traded below the average it was an amazing buying opportunity. Did we feel like it was at the time? Likely not, as living through tough markets is never easy.
This time doesn’t feel like the safest time to buy given the volatility and headline risk, but it certainly gives the trader a good reference point to manage risk. The market isn’t quite oversold just yet, but it’s getting there. Given horrible sentiment and the market at this interesting technical threshold, a quick and fast trip below the average could lead to a snapback rally.
If we can get – (1) positive economic data, and (2) a little more certainty out of Washington, then it could happen this week.
That may be a big IF.
Inflation Data
CPI in Focus. This Wednesday’s inflation data may hold the key to calming some of the recent market volatility if it reports in-line with analyst expectations. However, a rise in the key inflation metric may cause more uncertainty and angst to investors looking for good news.
Since the Fed first cut rates in September the inflationary number has stalled in its descent towards their stated 2% goal. In fact, the number has slightly increased each month since then. This month we are hoping to see our first decrease since then.
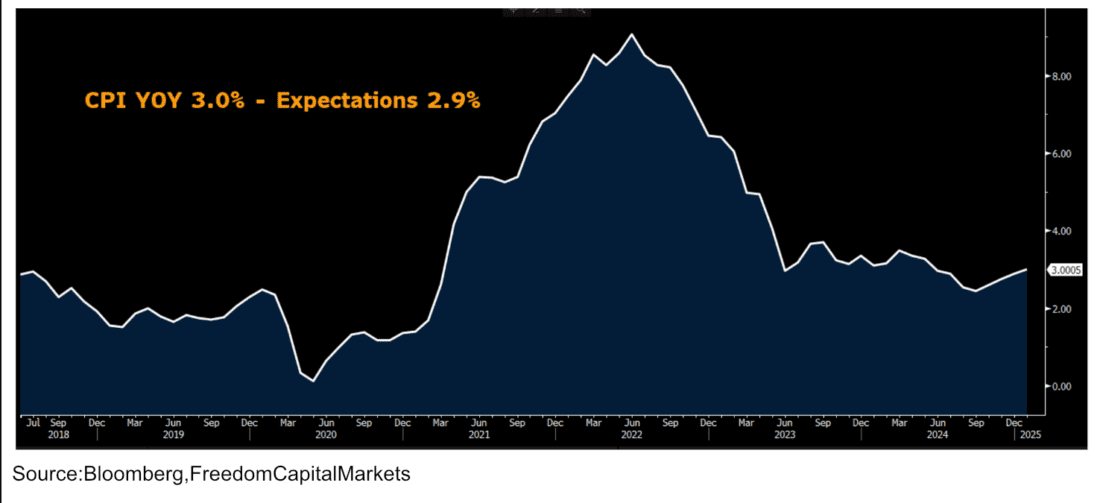
Given the uncertainty around tariffs, a small downtick could be music to this jittery market’s ears. However, an upward surprise a week before the next Fed meeting could put another cut on pause even longer. So far the Fed has downplayed stickier inflationary numbers, but can they and the market withstand a number that doesn’t decrease as expected?
Government Shutdown
Government Shutdown? We teased this topic a little last week. Later this week the topic has potential to be all we discuss.
Currently, the federal government is at risk of a shutdown if new funding legislation is not enacted by midnight on Friday, March 14th. Speaker Mike Johnson introduced a short-term funding bill that is expected to be voted on by The House by this Tuesday.
So what happens to the market while this drama plays out? Surprisingly the numbers are all over the place.

While shut-downs can add to near-term volatility – like we need more – there is no pattern of market behavior to assume this will have any major impact on price action. This has become a hot political football for decades now and it has become more of a “here we go again” event than anything else.
However, the biggest impact a shutdown caused was during Trump 1.0. The drama leading up to the 35-day shutdown did cause the S&P 500 to shed 8% in the week leading up to it. Yet the market rallied 10% during the shutdown and rallied afterwards.
Who knows what this one could bring? Given Trump 1.0 and the current fluctuations, it must be monitored closely.
—
Originally posted 10th March 2025
Investopedia.com: The comments, opinions and analyses expressed herein are for informational purposes only and should not be considered individual investment advice or recommendations to invest in any security or to adopt any investment strategy. While we believe the information provided herein is reliable, we do not warrant its accuracy or completeness. The views and strategies described on our content may not be suitable for all investors. Because market and economic conditions are subject to rapid change, all comments, opinions and analyses contained within our content are rendered as of the date of the posting and may change without notice. The material is not intended as a complete analysis of every material fact regarding any country, region, market, industry, investment or strategy. This information is intended for US residents only.
Information posted on IBKR Campus that is provided by third-parties does NOT constitute a recommendation that you should contract for the services of that third party. Third-party participants who contribute to IBKR Campus are independent of Interactive Brokers and Interactive Brokers does not make any representations or warranties concerning the services offered, their past or future performance, or the accuracy of the information provided by the third party. Past performance is no guarantee of future results.
This material is from Investopedia and is being posted with its permission. The views expressed in this material are solely those of the author and/or Investopedia and Interactive Brokers is not endorsing or recommending any investment or trading discussed in the material. This material is not and should not be construed as an offer to buy or sell any security. It should not be construed as research or investment advice or a recommendation to buy, sell or hold any security or commodity. This material does not and is not intended to take into account the particular financial conditions, investment objectives or requirements of individual customers. Before acting on this material, you should consider whether it is suitable for your particular circumstances and, as necessary, seek professional advice.
Related Articles


Join The Conversation
For specific platform feedback and suggestions, please submit it directly to our team using these instructions.
If you have an account-specific question or concern, please reach out to Client Services.
We encourage you to look through our FAQs before posting. Your question may already be covered!