
- Solve real problems with our hands-on interface
- Progress from basic puts and calls to advanced strategies
Interactive Options Course

Posted March 26, 2026 at 1:30 pm
The article “Increases CAPE Ratio Predictability with a Simple Adjustment” was originally posted on Alpha Architect blog.
CAPE has long been a cornerstone of long-horizon return forecasting. High valuations imply lower future returns. Low valuations imply higher future returns. Critics argue that its predictive power has faded in recent decades. This paper pushes back. It shows that the apparent decline is largely a measurement problem. When CAPE is constructed using aligned index constituents and market-cap weights, its out-of-sample predictive power exceeds 50 percent for ten-year returns. The result is a more precise and economically meaningful way to use valuation for long-term asset allocation.
The traditional CAPE mixes different index constituents across time
The standard CAPE divides today’s index level by ten-year average earnings. However, firms enter and exit the S&P 500 over time. The numerator reflects current constituents. The denominator includes earnings from firms that may no longer be in the index. The authors construct a Component CAPE that aligns prices and earnings for the same firms. This simple correction materially improves predictive accuracy.
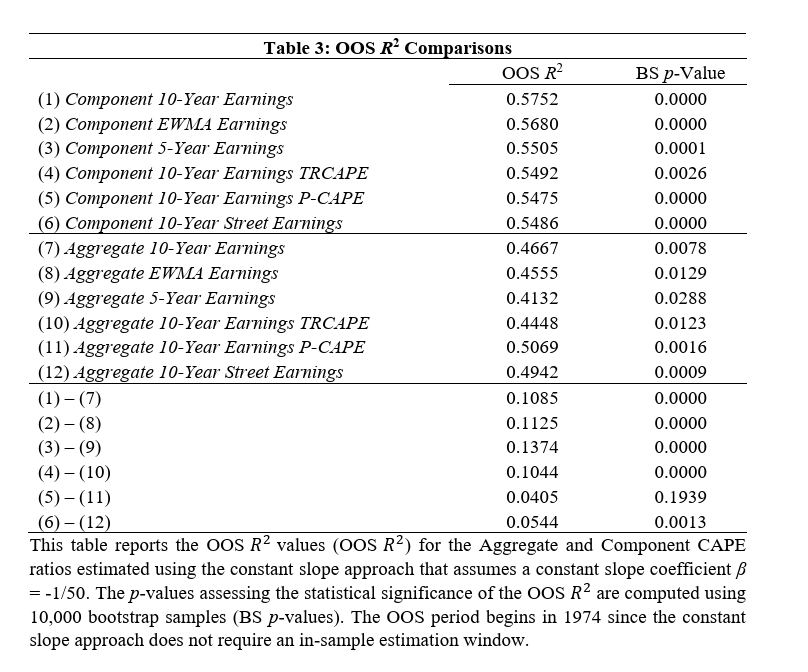
Out-of-sample predictive power exceeds 50 percent
Using a constant-slope out-of-sample framework, the Component 10-Year Earnings CAPE achieves an OOS R² of 0.5752, compared to 0.4667 for the Aggregate CAPE. The improvement is statistically significant and robust to bootstrap inference, Bonferroni correction, and false discovery rate adjustments.
The improvement is stronger in recent decades
The predictive gains are not confined to early sample periods. In fact, performance is stronger in the later subperiod when many commentators argued that CAPE had stopped working. The valuation-return relationship appears stable once measurement is corrected.
Weighting drives much of the difference
Mathematically, the traditional Aggregate CAPE is close to an earnings-weighted average of firm-level CAPEs. The Component CAPE instead uses market-cap weights. This weighting change explains a substantial portion of the difference in levels and predictive power. The market-cap weighted construction better reflects how capital is actually allocated in the index.
Economic value survives implementation tests
When used in a dynamic asset allocation framework, the Component CAPE delivers higher certainty equivalent returns than both the historical mean benchmark and a static 60/40 allocation. The gains are moderate but consistent across specifications.
Align your valuation inputs
If you rely on CAPE for strategic allocation, use a version that aligns current constituents with their own historical earnings. Avoid mixing different firm sets across numerator and denominator.
Be mindful of weighting
Recognize that the traditional CAPE implicitly resembles an earnings-weighted measure. A market-cap weighted construction produces systematically different signals. Choose the weighting scheme deliberately.
Focus on long horizons
The predictive power documented here applies to ten-year returns. CAPE is not a tactical timing tool. It is a strategic allocation input.
Combine with complementary signals
Valuation works best as one pillar in a broader framework. Integrate it with trend, macro, or risk-based signals rather than relying on a single metric.
“Valuations still matter. The apparent decline in CAPE’s usefulness largely reflects how it was measured. By aligning index constituents and using appropriate weights, we recover strong long-term predictive power. CAPE is not a short-term timing tool. It is a disciplined way to set long-horizon expectations and guide strategic asset allocation.”
The results are hypothetical results and are NOT an indicator of future results and do NOT represent returns that any investor actually attained. Indexes are unmanaged and do not reflect management or trading fees, and one cannot invest directly in an index.
We demonstrate that 10-year equity market returns are considerably more predictable in relation to price–earnings ratios than previously thought. The traditional approach involves relating the current index price level, based on current index components, to the index earnings of previous years, calculated using those years’ components. When we estimate the cyclically adjusted price–earnings (CAPE) ratio, ensuring that index component prices and earnings are aligned, and apply a superior regression approach, out-of-sample R2 values are over 50%. The Component CAPE ratio weights individual stock CAPE ratios by their market capitalization, whereas the traditional CAPE ratio is more closely aligned with earnings weighting.
The views and opinions expressed herein are those of the author and do not necessarily reflect the views of Alpha Architect, its affiliates or its employees. Our full disclosures are available here. Definitions of common statistics used in our analysis are available here (towards the bottom).
This site provides NO information on our value ETFs or our momentum ETFs. Please refer to this site.
Information posted on IBKR Campus that is provided by third-parties does NOT constitute a recommendation that you should contract for the services of that third party. Third-party participants who contribute to IBKR Campus are independent of Interactive Brokers and Interactive Brokers does not make any representations or warranties concerning the services offered, their past or future performance, or the accuracy of the information provided by the third party. Past performance is no guarantee of future results.
This material is from Alpha Architect and is being posted with its permission. The views expressed in this material are solely those of the author and/or Alpha Architect and Interactive Brokers is not endorsing or recommending any investment or trading discussed in the material. This material is not and should not be construed as an offer to buy or sell any security. It should not be construed as research or investment advice or a recommendation to buy, sell or hold any security or commodity. This material does not and is not intended to take into account the particular financial conditions, investment objectives or requirements of individual customers. Before acting on this material, you should consider whether it is suitable for your particular circumstances and, as necessary, seek professional advice.


Join The Conversation
For specific platform feedback and suggestions, please submit it directly to our team using these instructions.
If you have an account-specific question or concern, please reach out to Client Services.
We encourage you to look through our FAQs before posting. Your question may already be covered!