
- Solve real problems with our hands-on interface
- Progress from basic puts and calls to advanced strategies
Interactive Options Course
Posted October 9, 2026 at 10:30 am
Could the next nine months represent one of the most favorable periods for U.S. equities? According to historical data from Forecaster.biz, the answer may be yes.
October 9, 2026, marks the beginning of a particularly interesting seasonal window for the S&P 500. A window that combines the final quarter of a U.S. midterm election year with the first half of the following pre-presidential-election year.
Why does this matter? Because this specific period has historically delivered some remarkable results.
Using the Seasonality tool available on Forecaster.biz, I analyzed the performance of the S&P 500 across the last seven completed midterm election cycles, focusing on the period from approximately October 9 to July 17 of the following year.
The findings are striking: seven positive performances out of seven observations, a 100% historical win rate, and an average return of 19.1%.
Of course, historical performance never guarantees future results. But when a recurring pattern produces such consistent outcomes, I believe it deserves serious attention.
Most investors are familiar with traditional market seasonality, such as the tendency for November through April to outperform the summer months.
However, there is another important cycle that often receives less attention: the four-year U.S. presidential election cycle.
Historically, the second year of a presidential term, known as the midterm election year, has often been associated with uncertainty, volatility, and relatively disappointing equity market performance.
But something interesting tends to happen toward the end of that year.
As the midterm elections approach and political uncertainty begins to fade, the market has frequently entered a stronger phase, which can extend well into the following year.
This behavior is also documented in research on the presidential election cycle and has been discussed in previous articles published on Interactive Brokers Campus.
The historical pattern suggests that the final quarter of the midterm year, followed by the first two quarters of the pre-election year, can represent a particularly favorable combination.
And this is precisely where we find ourselves today.
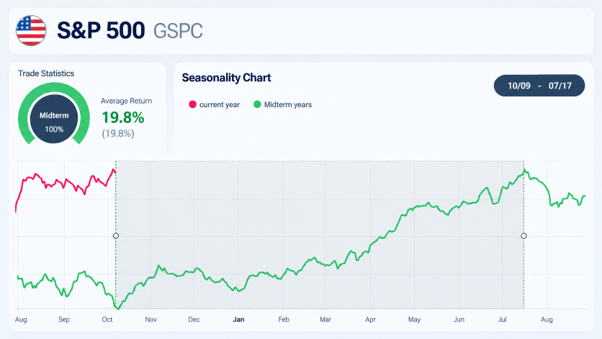
Figure 1. S&P 500 historical seasonality during midterm election years. The highlighted October–July window has delivered a 100% win rate across the last seven completed cycles, with an average return of 19.1%. Source: Forecaster.biz.
The chart above, generated using Forecaster.biz, illustrates the historical seasonal behavior of the S&P 500 during midterm election years. The green line represents the average seasonal pattern, while the pink line shows the performance of the current year up to October 2026.
What immediately stands out is what happens around the beginning of October.
Historically, this period has frequently marked the transition from a relatively weak or volatile market phase toward a much more constructive one. The average seasonal trajectory begins to recover during the final months of the midterm year before accelerating during the first half of the following year.
But the most remarkable finding emerges when we analyze the actual historical returns.
According to the Forecaster.biz Seasonality tool, the period from approximately October 9 to July 17 of the following year has generated some extraordinary statistics:
In other words, every single one of the seven historical observations ended with a positive S&P 500 return.
What makes this result particularly interesting is that these periods span very different economic and financial environments, including the dot-com bubble, the global financial crisis, major monetary policy shifts, geopolitical uncertainty, and the inflationary pressures of recent years.
Despite these differences, the outcome was consistently positive.
And perhaps the most important takeaway is that the historical strength is not limited to the traditional year-end rally. The seasonal pattern suggests that the upward movement has often continued through the spring and into early summer, potentially extending the opportunity across approximately nine months.
Of course, seven observations represent a relatively small sample, and historical consistency does not guarantee that the pattern will repeat. Nevertheless, a 100% historical win rate combined with an average gain of approximately 19% makes this one of the most compelling seasonal windows worth monitoring in the U.S. equity market.
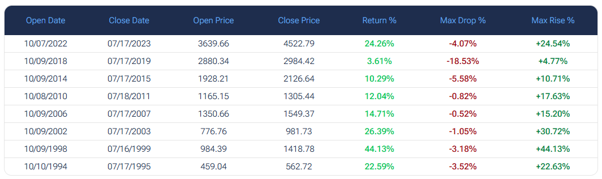
Figure 2. Individual S&P 500 returns and intra-period drawdowns during previous midterm-to-pre-election windows. Source: Forecaster.biz.
Looking at individual observations helps us understand the magnitude of these moves.
The strongest performance occurred between October 1998 and July 1999, when the S&P 500 gained approximately 47.9%.
More recently, the period between October 2022 and July 2023 generated a 24.3% return, despite the aggressive monetary tightening and recession concerns affecting financial markets at the time.
Other periods delivered smaller, but still positive, performances. For example, between October 2018 and July 2019, the S&P 500 gained approximately 3.5%.
That particular observation is an important reminder that a positive final return does not necessarily mean a smooth journey.
During the 2018–2019 observation, the market experienced a maximum intra-period decline of approximately 18.7% relative to its starting price, before ultimately closing the selected window in positive territory.
This distinction matters enormously.
Seasonality can help identify potentially favorable periods, but it cannot eliminate volatility, drawdowns, or the risk of unexpected events.
There are moments when market history offers investors particularly interesting perspectives.
I believe we may be entering one of those moments.
Starting in October 2026, the S&P 500 enters a seasonal period that has produced positive returns in all seven completed midterm cycles included in our Forecaster.biz analysis, with an average gain of approximately 19.1%.
That does not mean the market must rise by 19% over the next nine months. Nor does it mean that a correction cannot occur along the way.
It simply means that, from a historical seasonality perspective, the coming months deserve close attention.
If the historical pattern repeats, the final quarter of 2026 and the first half of 2027 could represent one of the most attractive stretches of the four-year presidential cycle.
And that is a possibility I would not ignore.
Source: Forecaster.biz, S&P 500 Seasonality and Trade Statistics. Historical observations from the October 1998–July 1999 through October 2022–July 2023 midterm cycles. Returns reflect index price changes over the selected dates, excluding dividends, trading costs, and taxes. Past performance is not indicative of future results. This article is intended for educational purposes and does not constitute investment advice.
The analysis in this material is provided for information only and is not and should not be construed as an offer to sell or the solicitation of an offer to buy any security. To the extent that this material discusses general market activity, industry or sector trends or other broad-based economic or political conditions, it should not be construed as research or investment advice. To the extent that it includes references to specific securities, commodities, currencies, or other instruments, those references do not constitute a recommendation by IBKR to buy, sell or hold such investments. This material does not and is not intended to take into account the particular financial conditions, investment objectives or requirements of individual customers. Before acting on this material, you should consider whether it is suitable for your particular circumstances and, as necessary, seek professional advice.
The views and opinions expressed herein are those of the author and do not necessarily reflect the views of Interactive Brokers, its affiliates, or its employees.
Related Articles
















Join The Conversation
For specific platform feedback and suggestions, please submit it directly to our team using these instructions.
If you have an account-specific question or concern, please reach out to Client Services.
We encourage you to look through our FAQs before posting. Your question may already be covered!