
- Solve real problems with our hands-on interface
- Progress from basic puts and calls to advanced strategies
Interactive Options Course

Posted September 22, 2026 at 11:15 am
Higher interest rates and a 10-year Treasury yield around 5% may look like obvious headwinds for equities. But when I look beneath the surface—at monetary policy, the economy, corporate earnings, valuations and historical market behavior—I still see several reasons to maintain a constructive view on the S&P 500.
On September 16, the Federal Reserve raised the target range for the federal funds rate by 25 basis points to 3.75%–4.00%. At almost the same time, the yield on the 10-year U.S. Treasury moved back above the psychologically important 5% level, reaching 5.01% on September 16.
At first glance, that combination appears uncomfortable for stocks.
Higher bond yields increase the discount rate applied to future corporate cash flows. At the same time, higher yields make fixed-income instruments more competitive with equities. When an investor can earn roughly 5% on a 10-year Treasury, the hurdle rate for taking equity risk naturally becomes higher.
But I think the more interesting question is not simply how high interest rates are, but why they are high.
The wording of the Fed’s latest statement is important. Despite raising rates, the FOMC said that economic activity was expanding at a solid pace, that domestic spending had remained resilient, productivity growth was strong and capital investment was robust.
That matters.
The Fed is not tightening monetary policy while simultaneously describing an economy in contraction. Instead, it is attempting to contain inflation while economic activity remains relatively resilient.
The labor market tells a similar story. U.S. unemployment stood at 4.1% in August, while nonfarm payroll employment increased by 162,000.
GDP growth has slowed but remains positive. The latest BEA estimate showed U.S. real GDP expanding at a 1.5% annualized rate in the second quarter, with consumer spending and investment contributing positively.
Even more interestingly, the Federal Reserve’s September projections show a median expectation of 2.3% real GDP growth for 2026, an unemployment rate of 4.1%, and a median appropriate federal funds rate of 4.1% at year-end. These are forecasts rather than guarantees, but they illustrate the Fed’s current base case: restrictive monetary policy does not automatically imply an imminent contraction.
A central bank operating with rates around 4% has more conventional policy room available if economic conditions deteriorate than one starting from rates close to zero. That does not eliminate recession risk, nor does it guarantee an effective policy response to a future shock. But it provides greater monetary-policy flexibility than the Fed had at the beginning of the pandemic period.
From that perspective, the latest hike can also be interpreted as an attempt to rebuild policy space while economic conditions remain relatively healthy.
The 5% level on the 10-year Treasury understandably attracts attention because it changes the relative attractiveness of bonds and equities.
But history reminds us that the relationship is not mechanical.
The 10-year yield also traded around 5% in late 2023. What followed demonstrated that high long-term rates, by themselves, are not sufficient to prevent equity markets from advancing.
The reason is straightforward: equity prices are ultimately influenced by several variables simultaneously.
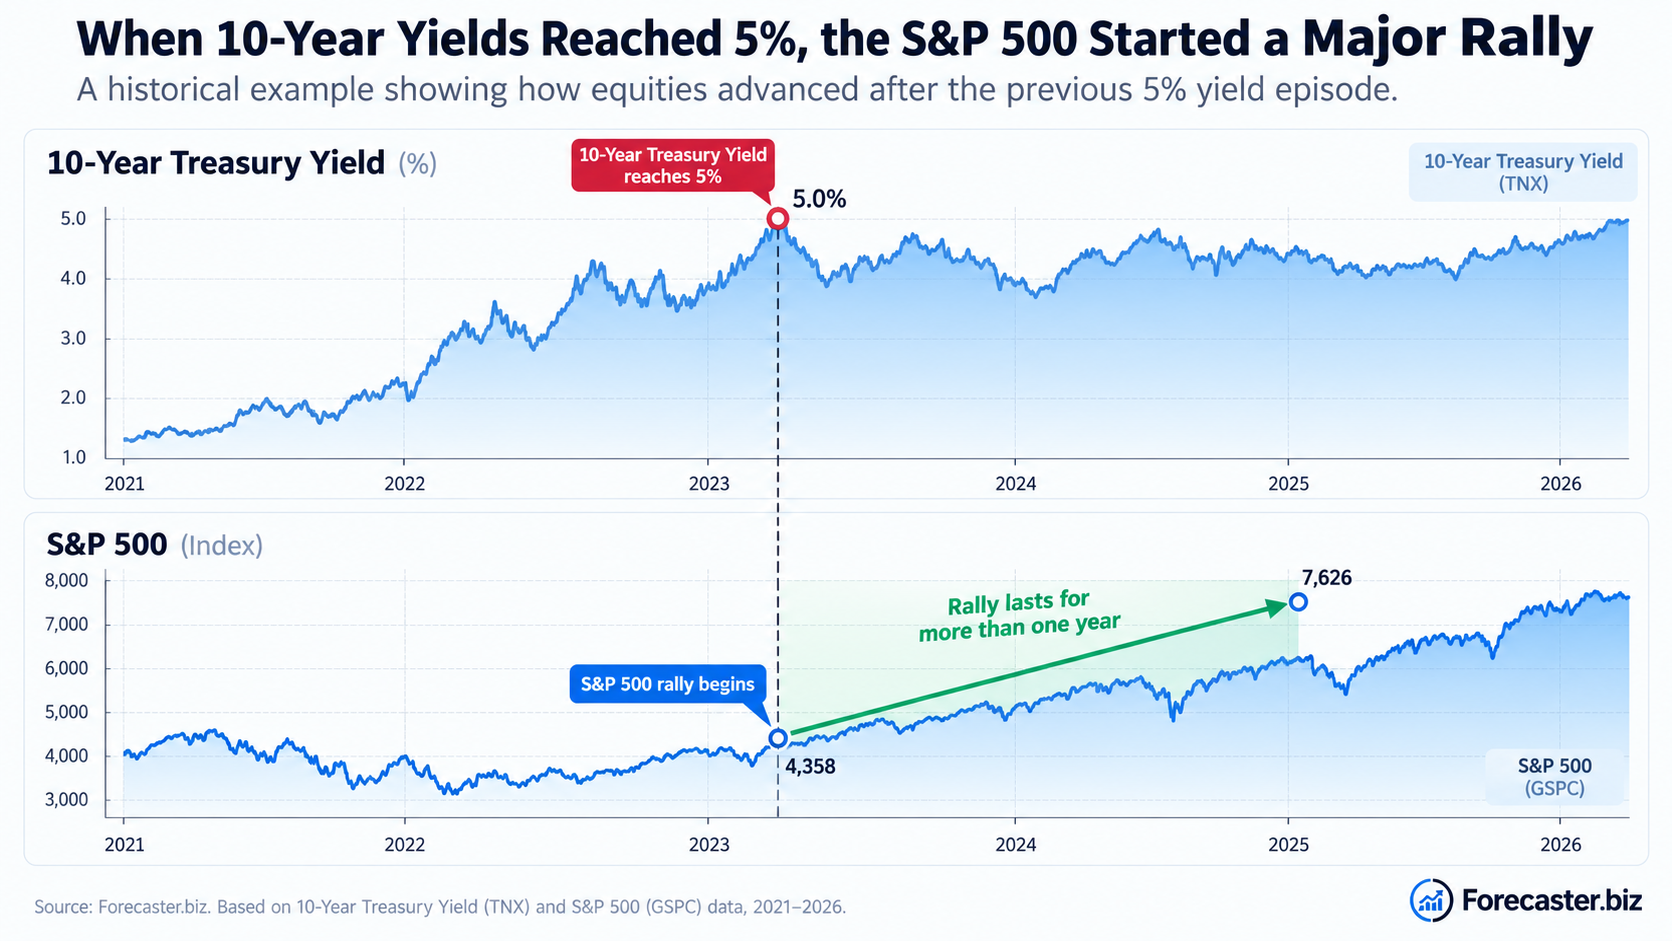
Rates matter. But so do economic growth, corporate revenues, margins, earnings expectations, liquidity and investor risk appetite.
If interest rates rise because economic activity and corporate earnings are stronger than expected, the effect on equities may be very different from a situation in which rates rise while profits are deteriorating.
And today, the earnings side of the equation deserves particular attention.
One of the strongest elements supporting my constructive S&P 500 view is corporate profitability.
FactSet’s Q2 reporting showed exceptionally strong earnings growth. Even excluding unusually large contributions from Alphabet and Amazon, the S&P 500’s Q2 earnings growth rate was still approximately 28.8% at the end of July. FactSet also reported that ten of the eleven S&P 500 sectors were producing year-over-year earnings growth at that stage of the reporting season.
Revenues have also been expanding. FactSet estimated Q2 S&P 500 revenue growth at approximately 15%, which, if confirmed, would represent the strongest revenue growth since late 2021.
This distinction is important when discussing whether U.S. equities are in a bubble.
Prices have risen substantially over the past several years, but so have the underlying earnings generated by S&P 500 companies.
For an equity market to sustain higher prices over long periods, earnings eventually need to support them. At the moment, earnings are still moving in the right direction.
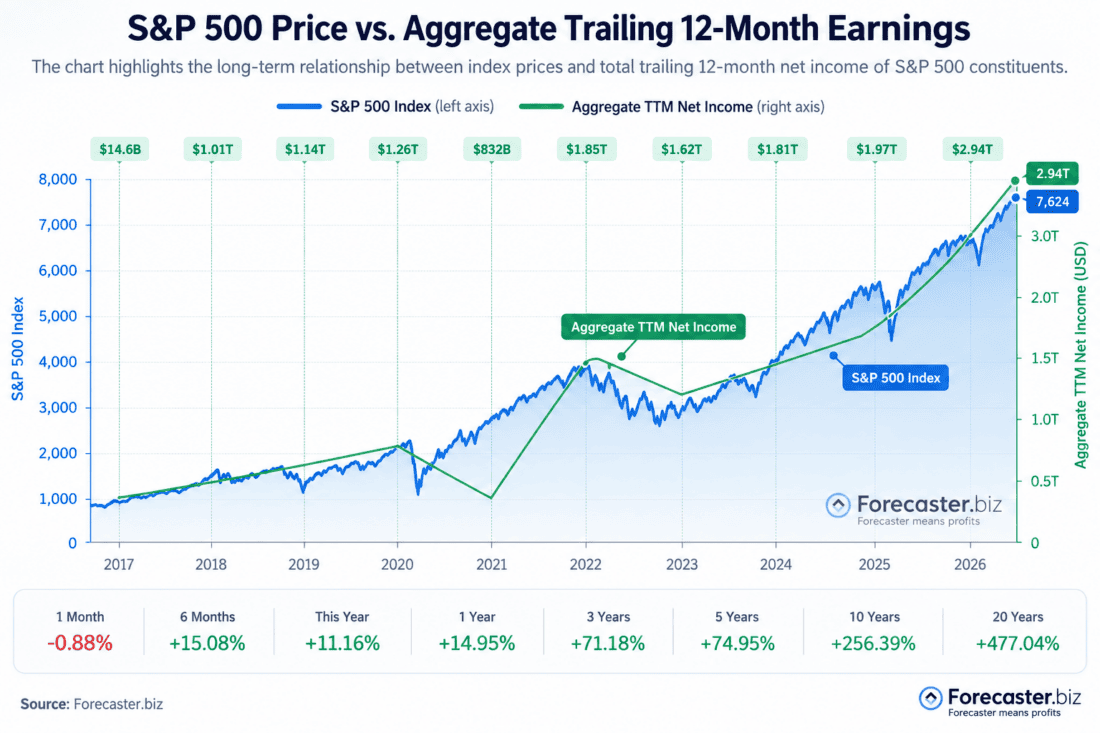
This is probably one of the most important charts in the article.
It helps shift the discussion away from the simplistic observation that “the index is at record highs” toward the more relevant question: what are the companies underlying the index actually earning?
The second element I monitor is valuation.
Using Forecaster’s aggregate fair-value framework, we calculate an estimated fair value for individual S&P 500 constituents and then aggregate those estimates according to their weight within the index.
Based on the latest calculation used in my analysis, the S&P 500 screens at approximately 15% below the aggregate fair value produced by our models.
That should not be interpreted as a price target or as a prediction that the index must rise by 15%.
Fair value is model-dependent. Different assumptions regarding growth, margins, discount rates and terminal values can generate materially different results. Other commonly used valuation metrics may also lead to different conclusions. For example, FactSet reported a forward 12-month P/E ratio of around 19.6 at the end of July, close to its five-year average and slightly above its ten-year average.
The takeaway, therefore, is not that U.S. equities are objectively “cheap.”
Rather, it is that the improvement in corporate fundamentals has partly offset the impact of high index levels in our valuation framework.
I would also show the comparison between the entire S&P 500 and its ten largest constituents, if the chart is visually clear.
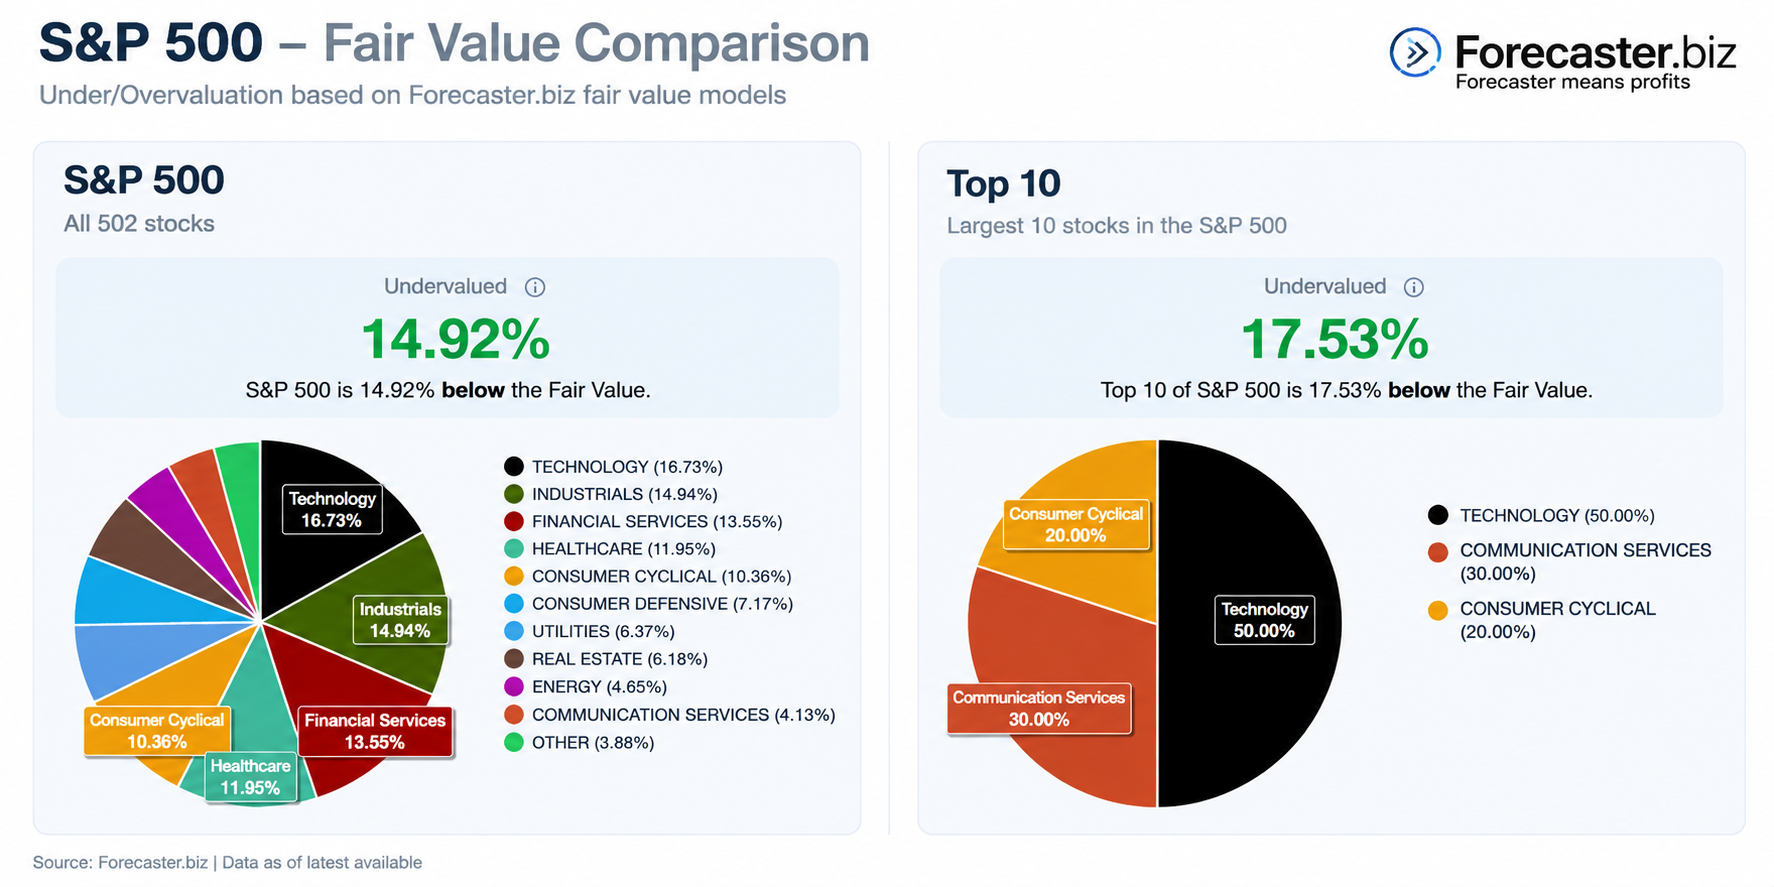
That is particularly relevant because one of the main concerns surrounding today’s market is index concentration. If your Forecaster analysis continues to show that the largest constituents are not necessarily the most stretched according to the same valuation framework, it adds useful context to the concentration debate without dismissing concentration itself as a risk.
There is another factor worth watching: seasonality.
Markets are currently approaching a part of the U.S. presidential cycle that has historically been constructive for equities.
Importantly, this is a statistical observation—not a forecast about the election itself, and not evidence that election outcomes cause market returns.
Independent historical research points to a similar pattern. Fidelity notes that the 12 months following U.S. midterm elections have historically been among the stronger periods within the four-year presidential cycle, while Schwab calculates that since 1974 the S&P 500 has averaged a 12.4% gain in the six months following midterm elections, with all 13 observations in its sample positive.
Forecaster’s seasonality analysis produces an even more specific window.
In the historical sample used by our software, the period beginning around October of a midterm year and extending into the following pre-election year has historically shown unusually strong S&P 500 performance.
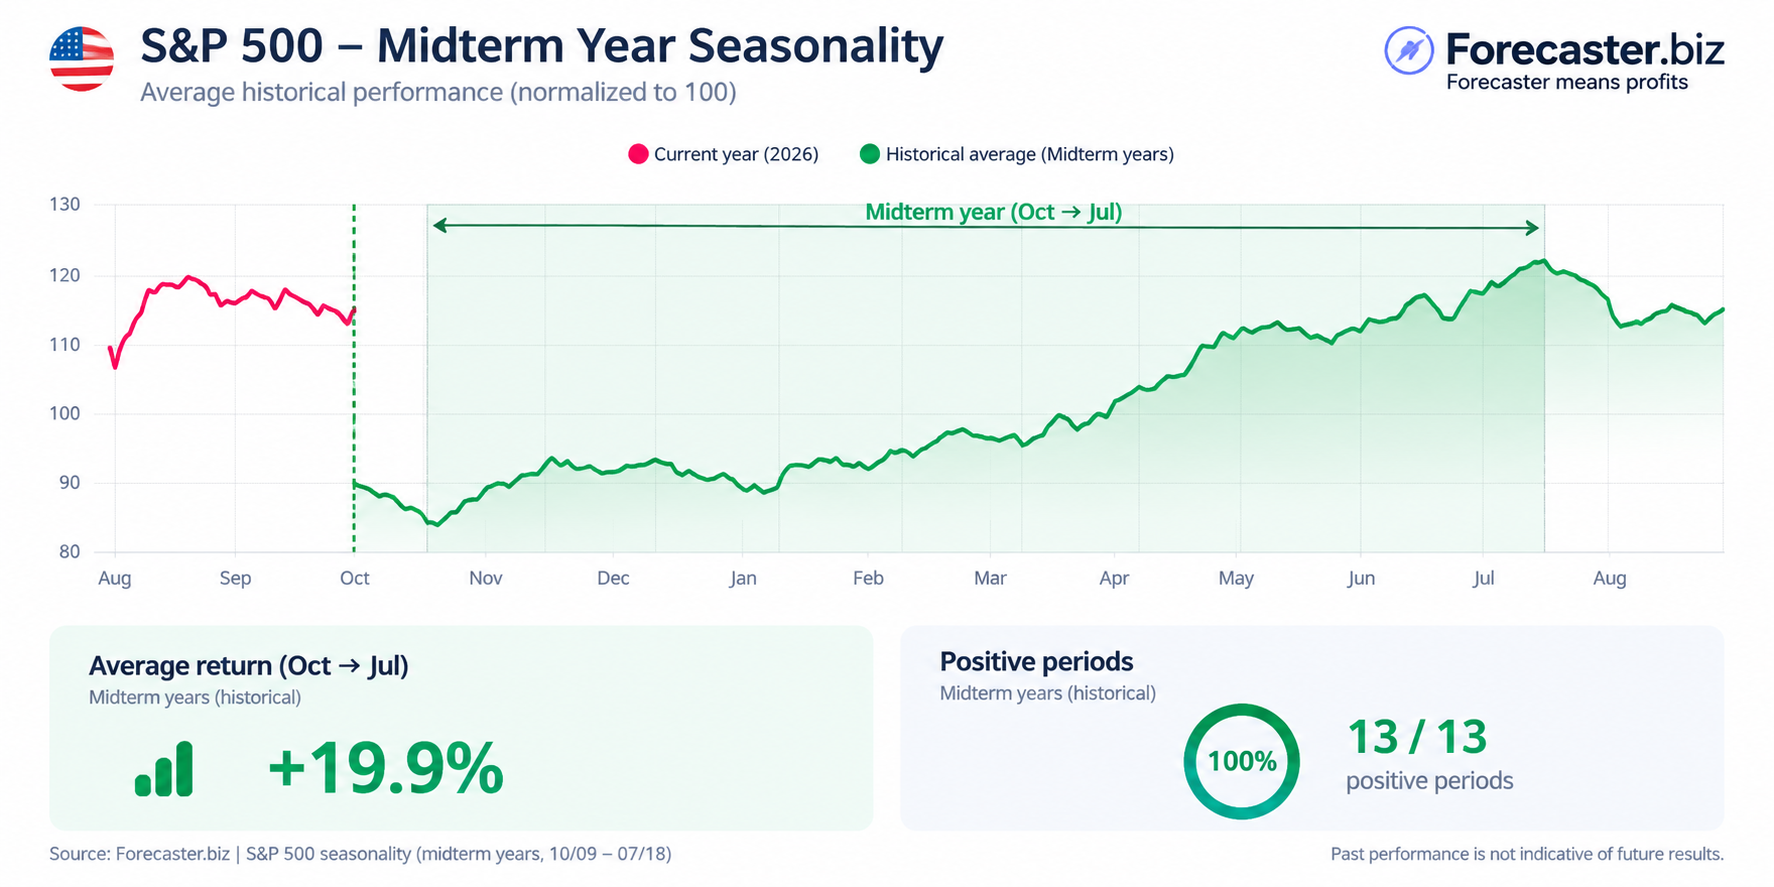
That historical pattern is interesting, but it needs to be interpreted carefully. The number of presidential cycles available for analysis is inherently limited, the macroeconomic environment changes from cycle to cycle, and historical seasonality cannot tell us what will happen in 2026 or 2027.
Still, when seasonality aligns with improving earnings and resilient economic data, I believe it becomes a useful additional piece of information.
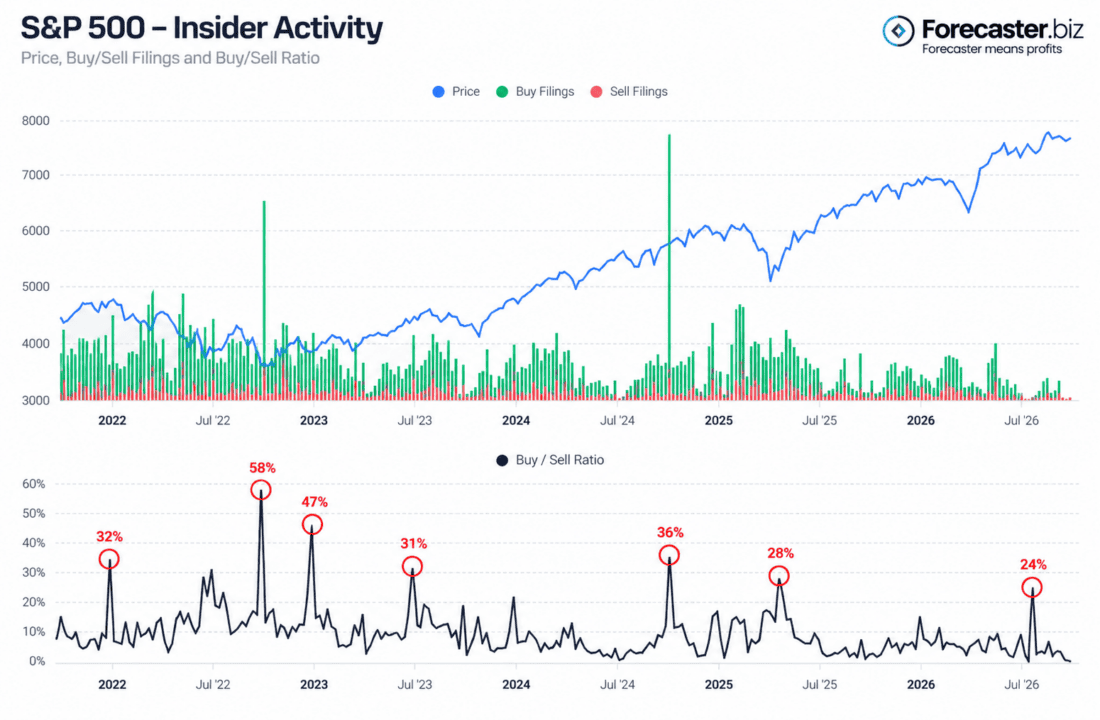
One additional dataset that I have recently started incorporating more systematically is insider activity.
Corporate officers, directors and other qualifying insiders in the United States disclose changes in beneficial ownership through SEC filings such as Form 4. These filings provide a large public dataset of transactions that can be analyzed at both the company and index level.
Forecaster aggregates these transactions for S&P 500 constituents and compares insider purchases with sales.
Recently, the aggregate buy/sell measure has shown one of its more notable buying spikes of the past several years.
I do not view insider activity as a standalone market-timing tool. Executives may sell shares for many reasons, including diversification, taxes, compensation arrangements and predetermined trading plans. Purchases can also have motivations that have little to do with near-term stock performance.
Nevertheless, when insider purchasing becomes unusually strong across a broad group of companies, I consider it a useful supplementary indicator of corporate confidence.
Finally, I think the artificial-intelligence debate is often framed too narrowly.
Much of the market discussion focuses on whether a handful of large technology companies have become too expensive or whether current AI investment levels are sustainable.
Those questions are valid.
But the longer-term impact may come from something broader: productivity.
Companies across the S&P 500 are increasingly integrating generative AI into software development, customer service, research, administration and other business processes.
If these tools allow companies to produce more output with the same number of employees—or the same output with fewer resources—the effect could eventually appear in operating margins and earnings.
Interestingly, the Federal Reserve itself highlighted strong productivity growth and robust capital investment in its latest policy statement. That does not prove that AI will generate higher equity returns, but it is consistent with the idea that productivity may become an increasingly important component of the economic cycle.
For me, this is the more interesting AI thesis.
The long-term question is not simply whether investors are willing to pay higher multiples for companies associated with artificial intelligence. It is whether AI can increase the earnings power of hundreds of companies across the index.
If that happens, the impact could extend well beyond the technology sector.
A constructive outlook should never be confused with the absence of risk.
The clearest challenge today remains inflation. The Fed’s September projections put median 2026 PCE inflation at 3.7% and core PCE at 3.4%, both above the central bank’s 2% longer-term objective.
If inflation remains sticky, interest rates could stay restrictive for longer than equity investors currently expect.
A sustained rise in Treasury yields would also increase competition from fixed income and place additional pressure on equity valuation multiples.
Index concentration remains another important risk. A relatively small group of companies represents a substantial portion of the S&P 500, meaning disappointments among the largest constituents can have an outsized impact on the benchmark.
And, of course, an unexpected economic or geopolitical shock can quickly invalidate even a strong fundamental setup.
These risks are precisely why I prefer to describe the current environment as constructive rather than risk-free.
The Fed has raised rates. The 10-year Treasury yield is around 5%. Inflation remains above target.
Those facts deserve attention.
But they are only one side of the equation.
The U.S. economy is still expanding. Unemployment remains relatively low. S&P 500 revenues and earnings continue to grow. Our Forecaster valuation models have improved as corporate fundamentals have strengthened. Historical midterm seasonality is entering a statistically interesting period. Insider activity has become more constructive, and AI-driven productivity could provide an additional longer-term earnings tailwind.
None of these factors guarantees higher stock prices, and corrections should always be considered part of normal market behavior.
But taken together, they explain why, despite higher interest rates and elevated Treasury yields, I continue to see a constructive medium-term setup for the S&P 500.
This material is provided for educational and informational purposes only and should not be construed as investment advice or as an offer, solicitation or recommendation to buy or sell any security. Historical performance and historical market patterns do not guarantee future results. Fair-value estimates and other model-based outputs depend on assumptions and may differ materially from actual market outcomes. Investors should consider their own objectives, circumstances and risk tolerance before making investment decisions.
Information posted on IBKR Campus that is provided by third-parties does NOT constitute a recommendation that you should contract for the services of that third party. Third-party participants who contribute to IBKR Campus are independent of Interactive Brokers and Interactive Brokers does not make any representations or warranties concerning the services offered, their past or future performance, or the accuracy of the information provided by the third party. Past performance is no guarantee of future results.
This material is from Forecaster.biz and is being posted with its permission. The views expressed in this material are solely those of the author and/or Forecaster.biz and Interactive Brokers is not endorsing or recommending any investment or trading discussed in the material. This material is not and should not be construed as an offer to buy or sell any security. It should not be construed as research or investment advice or a recommendation to buy, sell or hold any security or commodity. This material does not and is not intended to take into account the particular financial conditions, investment objectives or requirements of individual customers. Before acting on this material, you should consider whether it is suitable for your particular circumstances and, as necessary, seek professional advice.
Related Articles


















Join The Conversation
For specific platform feedback and suggestions, please submit it directly to our team using these instructions.
If you have an account-specific question or concern, please reach out to Client Services.
We encourage you to look through our FAQs before posting. Your question may already be covered!