
- Solve real problems with our hands-on interface
- Progress from basic puts and calls to advanced strategies
Interactive Options Course
Posted November 26, 2025 at 10:13 am
1/ While You Were Sleeping on Microcaps
2/ Market likes Mark’s thinking
3/ Are There Really 2000 Pips to be Had in this Trade?
Investopedia is partnering with CMT Association on this newsletter. The contents of this newsletter are for informational and educational purposes only, however, and do not constitute investing advice. The guest authors, which may sell research to investors, and may trade or hold positions in securities mentioned herein do not represent the views of CMT Association or Investopedia. Please consult a financial advisor for investment recommendations and services.
While You Were Sleeping on Microcaps
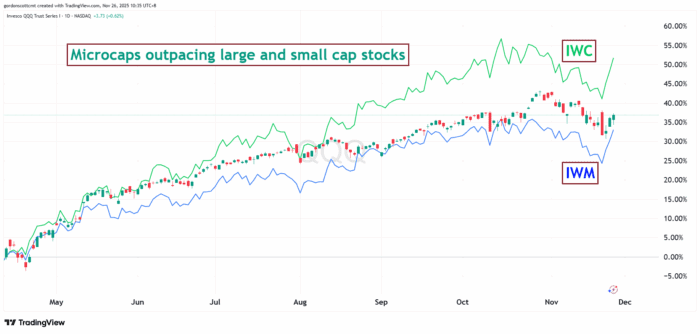
In the past three sessions stocks have rebounded impressively at every level of market capitalization. However the strongest rebound can be found among the index that tracks those stocks with a market capitalization of $300 million or less. These are the microcap stocks. Companies you likely have never heard of nor cared to seek out. And they are roundly outperforming their larger-company counterparts.
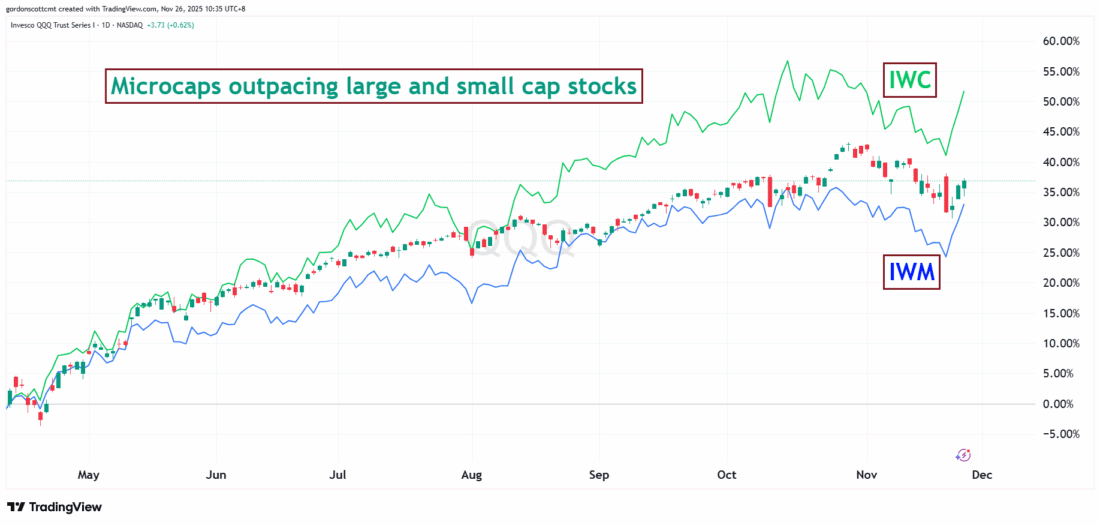
After investors settled down and got over their fears of runaway inflation from tariffs last April, stocks have roared higher. This chart shows the Nasdaq 100 index, as tracked by QQQ, improving roughly 40% at its highest point since that time. By contrast, iShares’ microcap ETF (IWC) has risen more than 50% in the same period.
It might be easy to dismiss this move by simply saying that the higher volatility of that asset class and its low-priced stocks would simply provide a higher beta, creating more reward with more risk. But that explanation falls short when considering the index in between: the Russell 2000.
Considering iShares’ better-known ETF that tracks the small cap index (IWM), you could apply the same standard and expect that IWM would have outperformed QQQ since April for the same reason–more volatility, more reward that comes from more risk. However that isn’t how things have played out. IWM (depicted by the blue line on the chart) clearly underperformed QQQ when measured from the same starting point.
The only remaining information to deduce is that investors clearly have a higher appetite for unusual risk right now. Perhaps those done holding on to Bitcoin are looking for similar returns elsewhere? Whatever the reason, microcaps continue to show relative strength compared to the rest of the market.
Market likes Mark’s thinking
Meta (META) has had a tough time getting investors to take its business seriously. One must find it difficult to get meaningful coverage from analysts and friendly media types after producing an earnings announcement that featured a bottom line miss of 84%. Tsk, Tsk, what’s a young CEO to do? Perhaps donning big boy clothes and schmoozing with your bitter-rival competitors is a good place to start.

Apparently that move is at least a little meaningful because when Meta announced they would buy Google’s AI chips instead of Nvidia’s, NVDA tumbled in pre-market trading, while META gapped up on the news. That said, the market is far from forgiving the 20 percent discount it handed METAs shares after the unpleasant surprise the company delivered. Meanwhile Nvidia is giving a golf clap to those taking this route, insisting they are already a generation ahead. Drama ahead, grab the popcorn!
Are There Really 2000 Pips to be Had in this Trade?
If you happened to have had one of those dire-warnings-about-the-BOJ videos hit your YouTube or Instagram feed lately, rest assured, you are not alone. The algos have begun serving up this theme and, to be fair, it isn’t without merit to discuss the unwinding of the carry trade.
And while it may be a bit hyperbolic to project the longer term ramifications of this trend, there is another reality to consider. It is ridiculously fun!
Normally I don’t consider chart patterns as a highly productive way to anticipate trades worth considering. Primarily because chart patterns are notorious for not showing a predictive edge. They do, however, make great planning tools when you come across a larger trend and you need to make a plan for how much to risk if you want to take advantage of it.
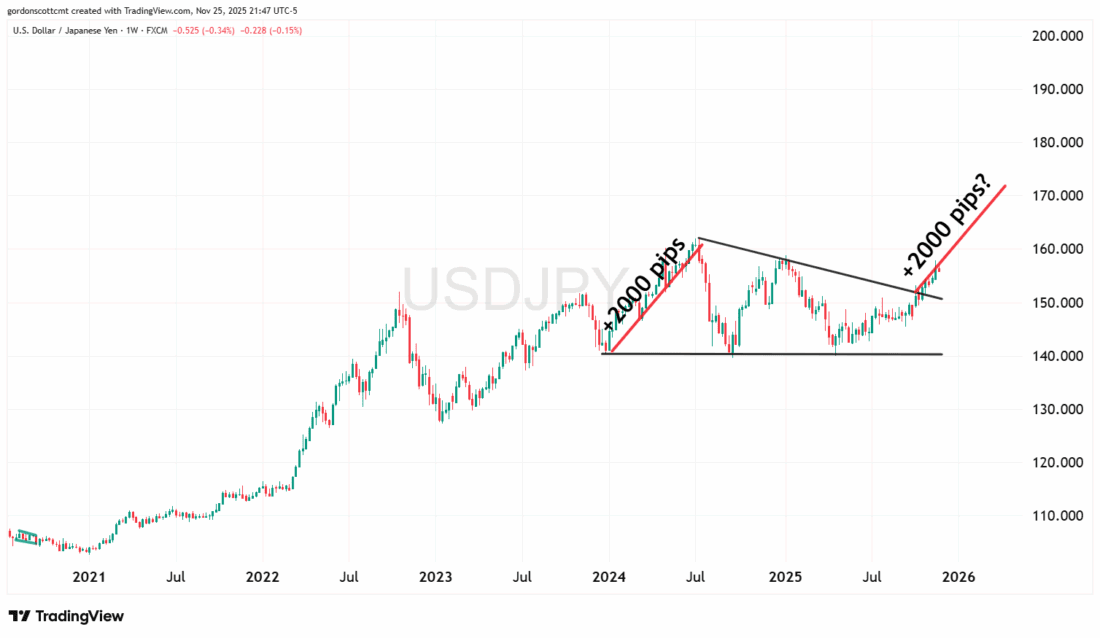
The chart above shows a descending wedge pattern in the price action on the weekly chart. This pattern is commonly considered to portend a bullish breakout, and provide a forecast for continuing the original trend to an extent that is equal or greater than the first move higher in the pattern. That is how we arrive at the possibility of a 2000 pip move further on the USDJPY currency pair.
Such a move might take as much as six months to play out and would have a very significant ripple effect around the world. What are the changes it will happen? I’d give it a 36% chance. That’s the average win rate for almost all trailing stop trends, and this forecasted move would certainly qualify for that strategy.
But like the other two charts above it, this trade signifies an important reality: there are many opportunities nowadays for the right investors – those not shying away from taking risk.
—
Originally posted 26th November 2025
Investopedia.com: The comments, opinions and analyses expressed herein are for informational purposes only and should not be considered individual investment advice or recommendations to invest in any security or to adopt any investment strategy. While we believe the information provided herein is reliable, we do not warrant its accuracy or completeness. The views and strategies described on our content may not be suitable for all investors. Because market and economic conditions are subject to rapid change, all comments, opinions and analyses contained within our content are rendered as of the date of the posting and may change without notice. The material is not intended as a complete analysis of every material fact regarding any country, region, market, industry, investment or strategy. This information is intended for US residents only.
Information posted on IBKR Campus that is provided by third-parties does NOT constitute a recommendation that you should contract for the services of that third party. Third-party participants who contribute to IBKR Campus are independent of Interactive Brokers and Interactive Brokers does not make any representations or warranties concerning the services offered, their past or future performance, or the accuracy of the information provided by the third party. Past performance is no guarantee of future results.
This material is from Investopedia and is being posted with its permission. The views expressed in this material are solely those of the author and/or Investopedia and Interactive Brokers is not endorsing or recommending any investment or trading discussed in the material. This material is not and should not be construed as an offer to buy or sell any security. It should not be construed as research or investment advice or a recommendation to buy, sell or hold any security or commodity. This material does not and is not intended to take into account the particular financial conditions, investment objectives or requirements of individual customers. Before acting on this material, you should consider whether it is suitable for your particular circumstances and, as necessary, seek professional advice.
Any discussion or mention of an ETF is not to be construed as recommendation, promotion or solicitation. All investors should review and consider associated investment risks, charges and expenses of the investment company or fund prior to investing. Before acting on this material, you should consider whether it is suitable for your particular circumstances and, as necessary, seek professional advice.
Related Articles


")


Join The Conversation
For specific platform feedback and suggestions, please submit it directly to our team using these instructions.
If you have an account-specific question or concern, please reach out to Client Services.
We encourage you to look through our FAQs before posting. Your question may already be covered!