
- Solve real problems with our hands-on interface
- Progress from basic puts and calls to advanced strategies
Interactive Options Course
Latest Webinars

Posted July 18, 2024 at 8:34 am
Gold Top? Potential Price Objectives
Investopedia is partnering with CMT Association on this newsletter. The contents of this newsletter are for informational and educational purposes only, however, and do not constitute investing advice. The guest authors, which may sell research to investors, and may trade or hold positions in securities mentioned herein do not represent the views of CMT Association or Investopedia. Please consult a financial advisor for investment recommendations and services.
Gold Top? Potential Price Objectives
Conclusion: In early 2024 gold reached the price objective derived from the breakout of the large triangle that had evolved beginning in early 2022. Upon reaching the area of the objective, a classic buying climax halted the trend. The subsequent trading range has been characterized by distribution. In the event of a breakout lower, the amount of distribution (cause) derived from the point and figure count suggests a downside objective of 10-12% lower is reasonable.
In this piece we make a technical assessment of the daily and weekly charts, provide evidence suggesting that the range is likely distribution (Wyckoff), and show how to assess potential price objectives using point and figure charts.
Gold Weekly:

In November 2023 gold broke above lateral resistance that had developed along the 2079-2085 area.
I particularly like Fibonacci extensions and retracements, point and figure chart projections and price channels.
Importantly the original breakout from the 2079- 2085 triangle generated a price objective of 2540.
In my view, triangle price objectives are AREAS to monitor for resistance rather than discrete points.
Additional objectives can be derived by using Fibonacci Objectives derived from the 1618 – 2085 – 1824 price sequence.
In March the market broke out of the triangle and over the next several weeks marked up to 245.
Generally speaking, there are only two outcomes to the range, either the buying climax is short term and the market will, after a period of re-accumulation, move higher or the buying climax will offer a significant top leading to a significant markdown once supply is completely distributed to weak hands.
This is the point where I shift attention to the daily perspective chart in order to closely monitor price spread and volume relationships.
Gold Daily:
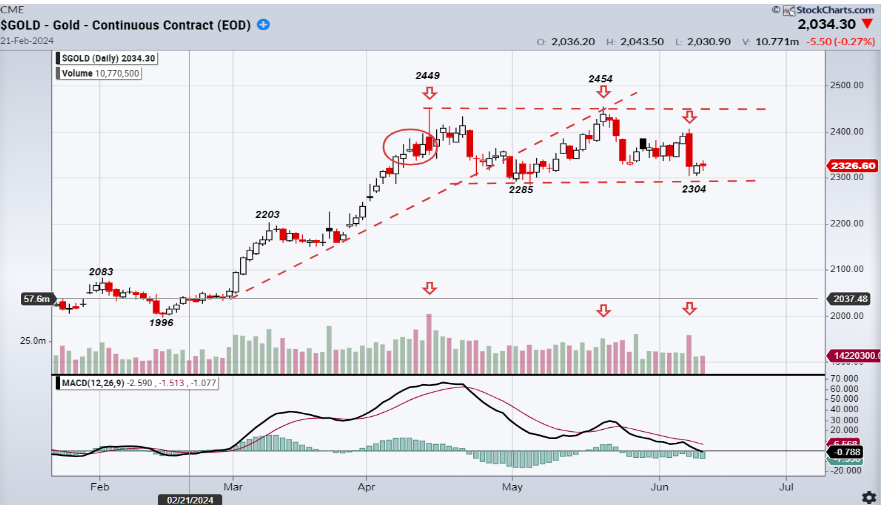
Without going into a detailed Wyckoff price/volume analysis I will make the case that it is likely that the range is one of distribution. Note the appearance of supply (inside the oval) just prior to the buying climax at 2449, the lower volume and angle of attack on the rally to 2454 (secondary test), and the expansion of volume and close near the low of the price spread (last arrow). Rallies inside the range are being aggressively sold as strong hands distribute to weak hands. Additionally, much of the price action has developed below the midpoint of the range.
With the assessment of distribution I begin planning for a bearish breakout. The first part of the plan is to arrive at some estimation of how much downside potential exists.
Gold Point and Figure 10-point boxes X 3 box reversal:
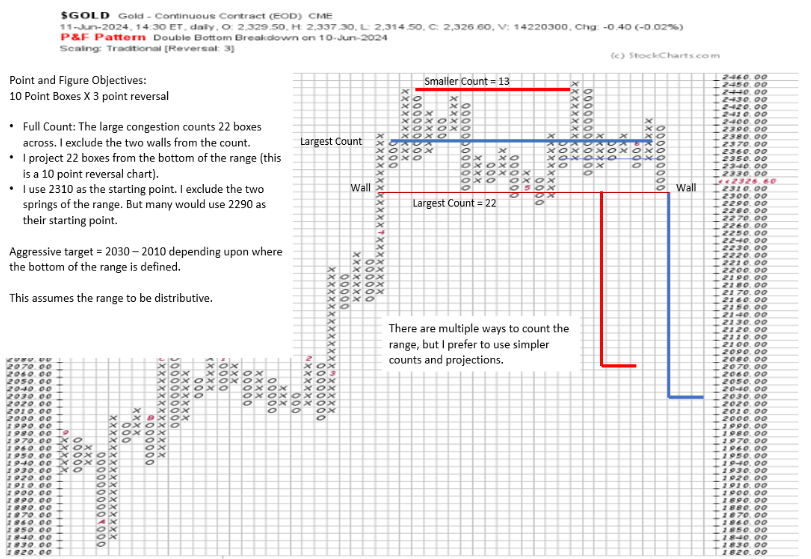
Trading ranges represent areas of the chart where large numbers of shares change hands, often moving from strong hands to weak hands. This is why there is a consistent relationship between the length of a trading range and the size of the subsequent move. This is particularly true in very liquid, heavily traded markets.
There is no end to the debate as to which points should be used to define counts. I like to keep it simple. I look for the walls of the range, count across the two walls, and then project from the low. Others would use the smaller count derived from the two walls between the buying climax and the secondary test. After all, I mostly use the objectives to help define risk vs reward and to help draw my attention to the chart as the area of the objectives is reached.
Assuming the current range DOES NOT EXTEND and I am correct in my assessment of distribution, the count projects enough cause to suggest downside of 2010 – 2030. If the range extends, the count will lengthen and the price objective grows greater.
With this view, I Should be able to fashion a trade well in excess of 3-1 (minimum) risk reward. I suspect that when a trade does set up, that risk reward will be in excess of 10-1 as a stop versus my entry is likely to be less than 1%.
If I am wrong and the range is one of re-accumulation the same method can be applied a breakout higher.
Note this is not a trading recommendation. Entry will be determined by price action and trade implementation techniques that I hope to present in future pieces.
—-
Originally posted 18th July 2024
Investopedia.com: The comments, opinions and analyses expressed herein are for informational purposes only and should not be considered individual investment advice or recommendations to invest in any security or to adopt any investment strategy. While we believe the information provided herein is reliable, we do not warrant its accuracy or completeness. The views and strategies described on our content may not be suitable for all investors. Because market and economic conditions are subject to rapid change, all comments, opinions and analyses contained within our content are rendered as of the date of the posting and may change without notice. The material is not intended as a complete analysis of every material fact regarding any country, region, market, industry, investment or strategy. This information is intended for US residents only.
Information posted on IBKR Campus that is provided by third-parties does NOT constitute a recommendation that you should contract for the services of that third party. Third-party participants who contribute to IBKR Campus are independent of Interactive Brokers and Interactive Brokers does not make any representations or warranties concerning the services offered, their past or future performance, or the accuracy of the information provided by the third party. Past performance is no guarantee of future results.
This material is from Investopedia and is being posted with its permission. The views expressed in this material are solely those of the author and/or Investopedia and Interactive Brokers is not endorsing or recommending any investment or trading discussed in the material. This material is not and should not be construed as an offer to buy or sell any security. It should not be construed as research or investment advice or a recommendation to buy, sell or hold any security or commodity. This material does not and is not intended to take into account the particular financial conditions, investment objectives or requirements of individual customers. Before acting on this material, you should consider whether it is suitable for your particular circumstances and, as necessary, seek professional advice.
Related Articles


Join The Conversation
For specific platform feedback and suggestions, please submit it directly to our team using these instructions.
If you have an account-specific question or concern, please reach out to Client Services.
We encourage you to look through our FAQs before posting. Your question may already be covered!