
- Solve real problems with our hands-on interface
- Progress from basic puts and calls to advanced strategies
Interactive Options Course
Posted September 18, 2025 at 9:26 am
By Todd Stankiewicz CMT, CFP, ChFC
1/ Daily Yield Chart – A Bullish Engulfing
2/ Weekly Chart: Momentum Holds
3/ Monthly Yield Chart – Bollinger Bands Signal a Big Move May Be Ahead
Investopedia is partnering with CMT Association on this newsletter. The contents of this newsletter are for informational and educational purposes only, however, and do not constitute investing advice. The guest authors, which may sell research to investors, and may trade or hold positions in securities mentioned herein do not represent the views of CMT Association or Investopedia. Please consult a financial advisor for investment recommendations and services.
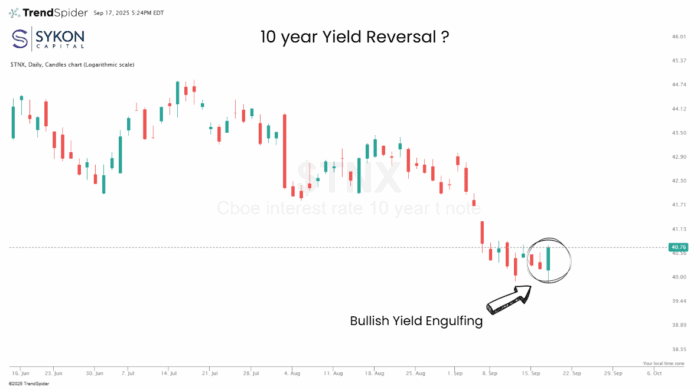
Daily Yield Chart – A Bullish Engulfing

The Fed cut rates by 25 basis points yesterday, exactly as expected. The equity market had this move priced in, so the more interesting action showed up in Treasuries. Instead of continuing lower, the 10-year Treasury yield ($TNX) bounced sharply.
Yields dipped below 4 percent intraday and then finished a little over 4.07 percent. That reversal created a bullish engulfing pattern on the daily chart, which is a technical signal that often points to a short-term shift in direction. Since yields and prices move opposite of one another, this tells us Treasury prices may move lower and yields may head higher in the days ahead.
We have seen this before. Back in September 2024, yields fell into a Fed cut and then turned higher afterward. That reversal led to a multi-week rally in yields. The setup today looks very similar.
The daily chart is flashing short-term volatility. Inflation and labor reports will be the catalyst, and investors should be ready for quick swings as the market reacts to what the Fed actually does versus what is already priced in.
Weekly 10 yr Chart – Pennant Pattern Near Resolution
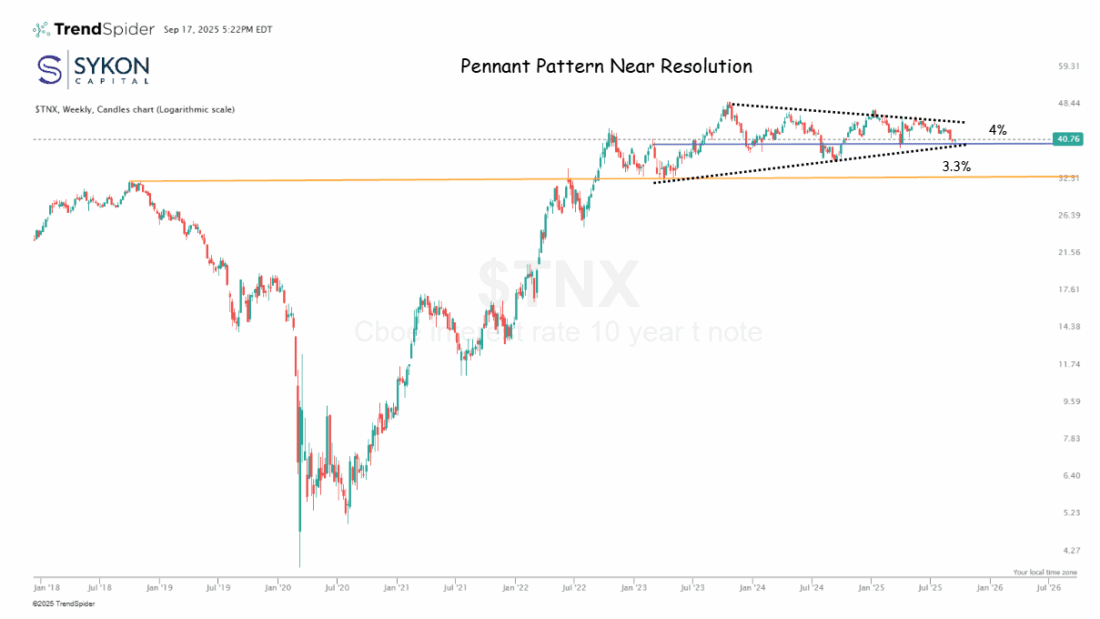
On the weekly chart, the story gets more interesting. The 10-year yield is sitting right above key support near 4%, with another zone of support closer to 3.3%, which lines up with peaks from 2018 and 2022.
Since early 2024, yields have been forming a pennant pattern. Pennants usually act as continuation patterns, meaning the prior trend continues after the consolidation. In this case, the prior trend is towards higher yields.
Yesterday’s bounce came right at the lower trendline of the pennant and off the 4 percent support level. That adds weight to the idea that this pattern is valid and raises the odds that the breakout may actually be higher. The range is getting tighter, and the market is running out of room. A sustained move above 4.2% would point toward a retest of 4.3 to 4.4%, while a move below 3.9% would set up a test of 3.3%.
The pennant on the weekly chart is getting close to resolution. Expect more choppy trading inside this range until the breakout comes. Investors need to be ready for momentum to accelerate once yields pick a direction.
Monthly Yield Chart – Bollinger Bands Signal a Big Move May Be Ahead
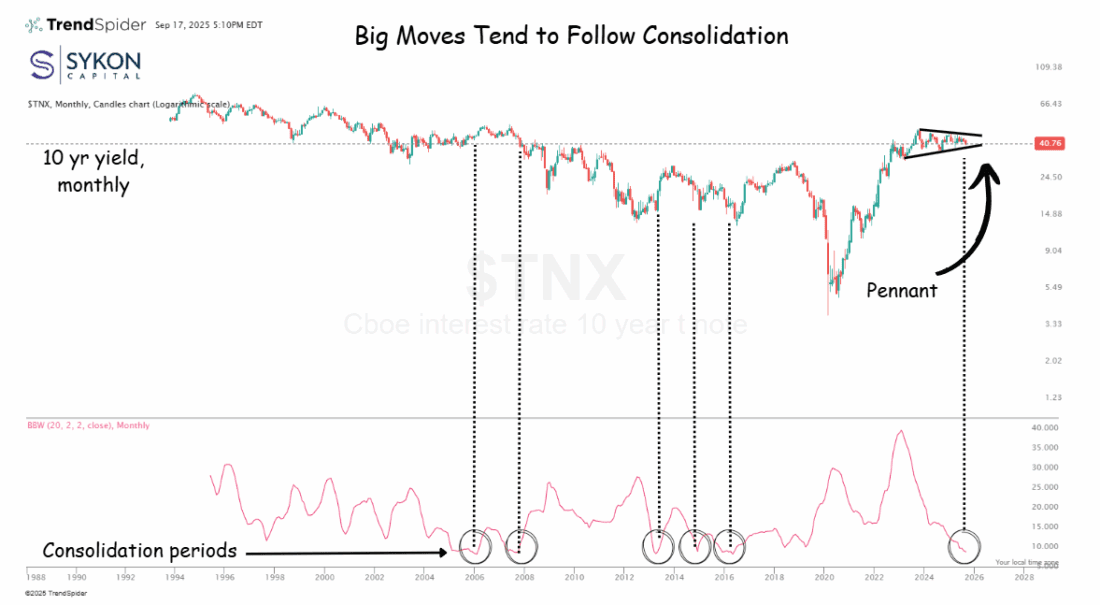
The monthly chart gives us the bigger picture. The Bollinger Band width, which measures volatility, has been narrowing. Each time we see that happen, it marks a period of consolidation. History tells us that narrow bands are usually followed by a big move, often to the upside in yields.
Right now, the bands are tight again, lining up with the pennant pattern we see on the weekly chart. That means the 10-year yield is in a holding pattern, but it will not stay this way much longer.
If inflation pressures stay sticky, yields are more likely to break higher, testing 4.4% or more. If inflation cools, yields could break lower toward 3.3%. Either way, the odds are low that the 10-year yield is still at 4% a few months from now.
The monthly chart reinforces that a bigger move is coming. This is not a setup to try to front-run. Let the market break first, then react. The outcome will be shaped by inflation data and how policy evolves, and the fallout could have ripple effects across equities, housing, and credit.
—
Originally posted 18th September 2025
Investopedia.com: The comments, opinions and analyses expressed herein are for informational purposes only and should not be considered individual investment advice or recommendations to invest in any security or to adopt any investment strategy. While we believe the information provided herein is reliable, we do not warrant its accuracy or completeness. The views and strategies described on our content may not be suitable for all investors. Because market and economic conditions are subject to rapid change, all comments, opinions and analyses contained within our content are rendered as of the date of the posting and may change without notice. The material is not intended as a complete analysis of every material fact regarding any country, region, market, industry, investment or strategy. This information is intended for US residents only.
Information posted on IBKR Campus that is provided by third-parties does NOT constitute a recommendation that you should contract for the services of that third party. Third-party participants who contribute to IBKR Campus are independent of Interactive Brokers and Interactive Brokers does not make any representations or warranties concerning the services offered, their past or future performance, or the accuracy of the information provided by the third party. Past performance is no guarantee of future results.
This material is from Investopedia and is being posted with its permission. The views expressed in this material are solely those of the author and/or Investopedia and Interactive Brokers is not endorsing or recommending any investment or trading discussed in the material. This material is not and should not be construed as an offer to buy or sell any security. It should not be construed as research or investment advice or a recommendation to buy, sell or hold any security or commodity. This material does not and is not intended to take into account the particular financial conditions, investment objectives or requirements of individual customers. Before acting on this material, you should consider whether it is suitable for your particular circumstances and, as necessary, seek professional advice.
Related Articles


Join The Conversation
For specific platform feedback and suggestions, please submit it directly to our team using these instructions.
If you have an account-specific question or concern, please reach out to Client Services.
We encourage you to look through our FAQs before posting. Your question may already be covered!