
- Solve real problems with our hands-on interface
- Progress from basic puts and calls to advanced strategies
Interactive Options Course
Latest Webinars
Posted March 14, 2025 at 11:15 am
1/ What a Countertrend Bounce Could Look Like
2/ Defining Downside Targets for Home Depot
3/ Intel and Confirming an Accumulation Phase
Investopedia is partnering with CMT Association on this newsletter. The contents of this newsletter are for informational and educational purposes only, however, and do not constitute investing advice. The guest authors, which may sell research to investors, and may trade or hold positions in securities mentioned herein do not represent the views of CMT Association or Investopedia. Please consult a financial advisor for investment recommendations and services.
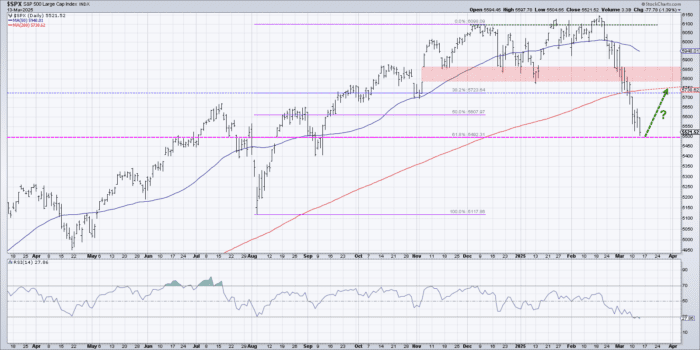
What a Countertrend Bounce Could Look Like
The S&P 500 is within a stone’s throw of our downside target following the break of 5850 earlier this month. While our medium-term indicators suggest further downside before an ultimate bottom is achieved, we see a short-term upswing as a likely scenario in the coming weeks.
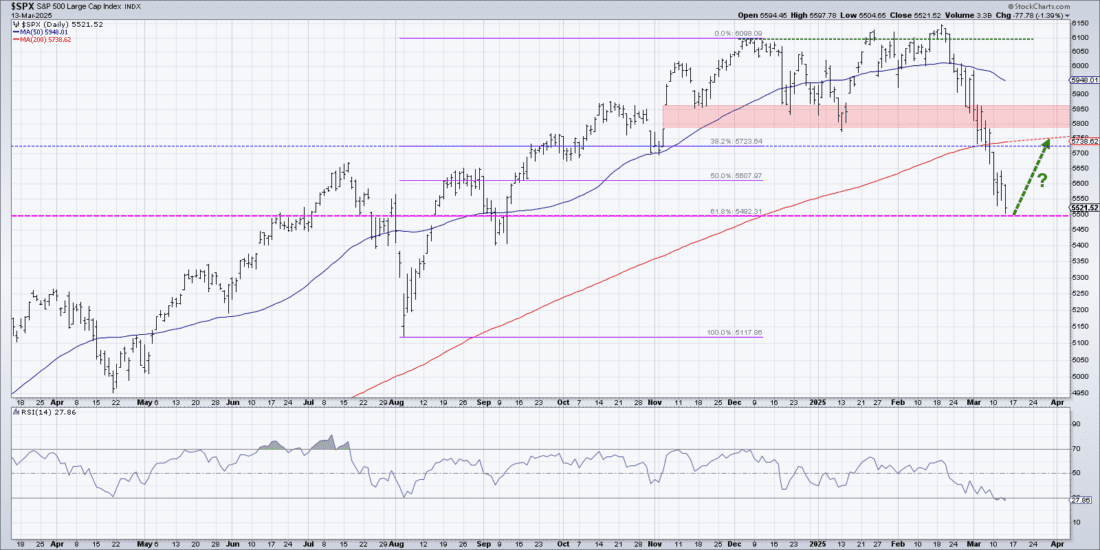
Using the August 2024 low and December 2024 high, we created a Fibonacci framework that yielded a 61.8% retracement level right around 5500. Given the severity of the selloff over the last four weeks, it’s not surprising that the S&P 500 is now oversold for the first time since October 2023.
Given the oversold condition and the test of Fibonacci support, a countertrend bounce seems a likely outcome. A rally back up to test the 200-day moving average from below would also line up fairly well with the 38.2% retracement level around 5725. While a short-term relief rally from around current levels seems a plausible move given the price deterioration so far, we would need to see dramatic improvements in market breadth indicators and leadership rotation to suggest a more meaningful recovery for the S&P 500.
Defining Downside Targets for Home Depot
The chart of Home Depot (HD) seems to have it all from a technical perspective. From the bearish momentum divergence into the December high, to a fully-formed and confirmed head and shoulders topping pattern, this chart would make both Edwards & Magee proud. Let’s review the downside objectives as implied by the recent topping phase.

The head and shoulders pattern that formed from October 2024 to March 2025 has an almost perfect symmetry between the left and right sides of the pattern. Note how the neckline of the pattern also lines up well with the 200-day moving average, meaning that the break below support around $380 was an important factor from a technical perspective.
Using the height of the pattern results in a minimum downside objective around $328, representing a 13% decline from neckline support. We can see this price target lines up well with the swing lows from summer 2024, confirming a likely support range in the weeks to come. Once this downside target is achieved, we would be looking for signs of short-term accumulation to confirm an upside reversal.
Intel and Confirming an Accumulation Phase
Intel (INTC) has been rangebound for the last seven months after an earnings gap in August 2024 drove the stock down below $20. We’ll use this chart to demonstrate a clear rotation from a distribution phase to a consolidation phase, and also what we’d need to see to confirm a new accumulation phase.

From December 2023 through August 2024, INTC dropped from a peak at about $50 down to a low around $19. Following this almost 60% drop, formed by a stepwise pattern of lower lows and lower highs, Intel settled into a rangebound pattern with resistance around $26 and support at those same August lows. We had rotated from a distribution pattern of lower highs and lower lows to a consolidation pattern of stable highs and stable lows.
What would we need to see to declare an end to the consolidation phase, and the beginning of a new accumulation phase? Intel would need to demonstrate a valid breakout above the November 2024 and February 2025 highs around $26. That breakout would also push INTC back above the 200-day moving average. Assuming a higher price low after that breakout, and a 200-day moving average sloping back upwards, we’d consider Intel back in a primary bullish trend phase. For now, this stock remains rangebound until further notice.
—
Originally posted 14th March 2025
For specific platform feedback and suggestions, please submit it directly to our team using these instructions.
If you have an account-specific question or concern, please reach out to Client Services.
We encourage you to look through our FAQs before posting. Your question may already be covered!
Investopedia.com: The comments, opinions and analyses expressed herein are for informational purposes only and should not be considered individual investment advice or recommendations to invest in any security or to adopt any investment strategy. While we believe the information provided herein is reliable, we do not warrant its accuracy or completeness. The views and strategies described on our content may not be suitable for all investors. Because market and economic conditions are subject to rapid change, all comments, opinions and analyses contained within our content are rendered as of the date of the posting and may change without notice. The material is not intended as a complete analysis of every material fact regarding any country, region, market, industry, investment or strategy. This information is intended for US residents only.
Information posted on IBKR Campus that is provided by third-parties does NOT constitute a recommendation that you should contract for the services of that third party. Third-party participants who contribute to IBKR Campus are independent of Interactive Brokers and Interactive Brokers does not make any representations or warranties concerning the services offered, their past or future performance, or the accuracy of the information provided by the third party. Past performance is no guarantee of future results.
This material is from Investopedia and is being posted with its permission. The views expressed in this material are solely those of the author and/or Investopedia and Interactive Brokers is not endorsing or recommending any investment or trading discussed in the material. This material is not and should not be construed as an offer to buy or sell any security. It should not be construed as research or investment advice or a recommendation to buy, sell or hold any security or commodity. This material does not and is not intended to take into account the particular financial conditions, investment objectives or requirements of individual customers. Before acting on this material, you should consider whether it is suitable for your particular circumstances and, as necessary, seek professional advice.
Related Articles


It looks to me like stocks have topped, it’s going to be a down year. The first warning actually came in January, when the S&P fell below its December low. After the election, META went up 20 straight days, and stocks with ridiculous valuations went vertical. The S&P 500 market cap went above $50 Trillion. The air is finally coming out of the bubble, You will definitely see the S&P at 4500 again, maybe 4000.