
- Solve real problems with our hands-on interface
- Progress from basic puts and calls to advanced strategies
Interactive Options Course
Posted March 5, 2025 at 4:31 am
From SIA Charts
Investopedia is partnering with CMT Association on this newsletter. The contents of this newsletter are for informational and educational purposes only, however, and do not constitute investing advice. The guest authors, which may sell research to investors, and may trade or hold positions in securities mentioned herein do not represent the views of CMT Association or Investopedia. Please consult a financial advisor for investment recommendations and services.
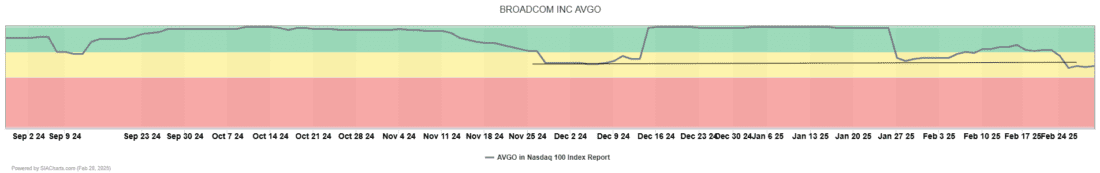
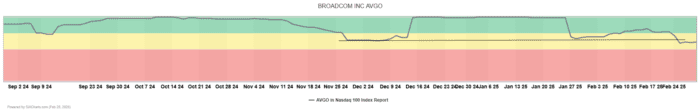
Shares of Broadcom Inc. (AVGO) continue to lose momentum within the SIA NASDAQ 100 Index Report, having fluctuated in and out of the favored zone of the report several times in the past quarter, as seen in the attached matrix position chart. These fluctuations have put SIA practitioners on high alert, especially given that the SIA Electronics & Semiconductor group is now an unfavored sector within the SIA market sector report.
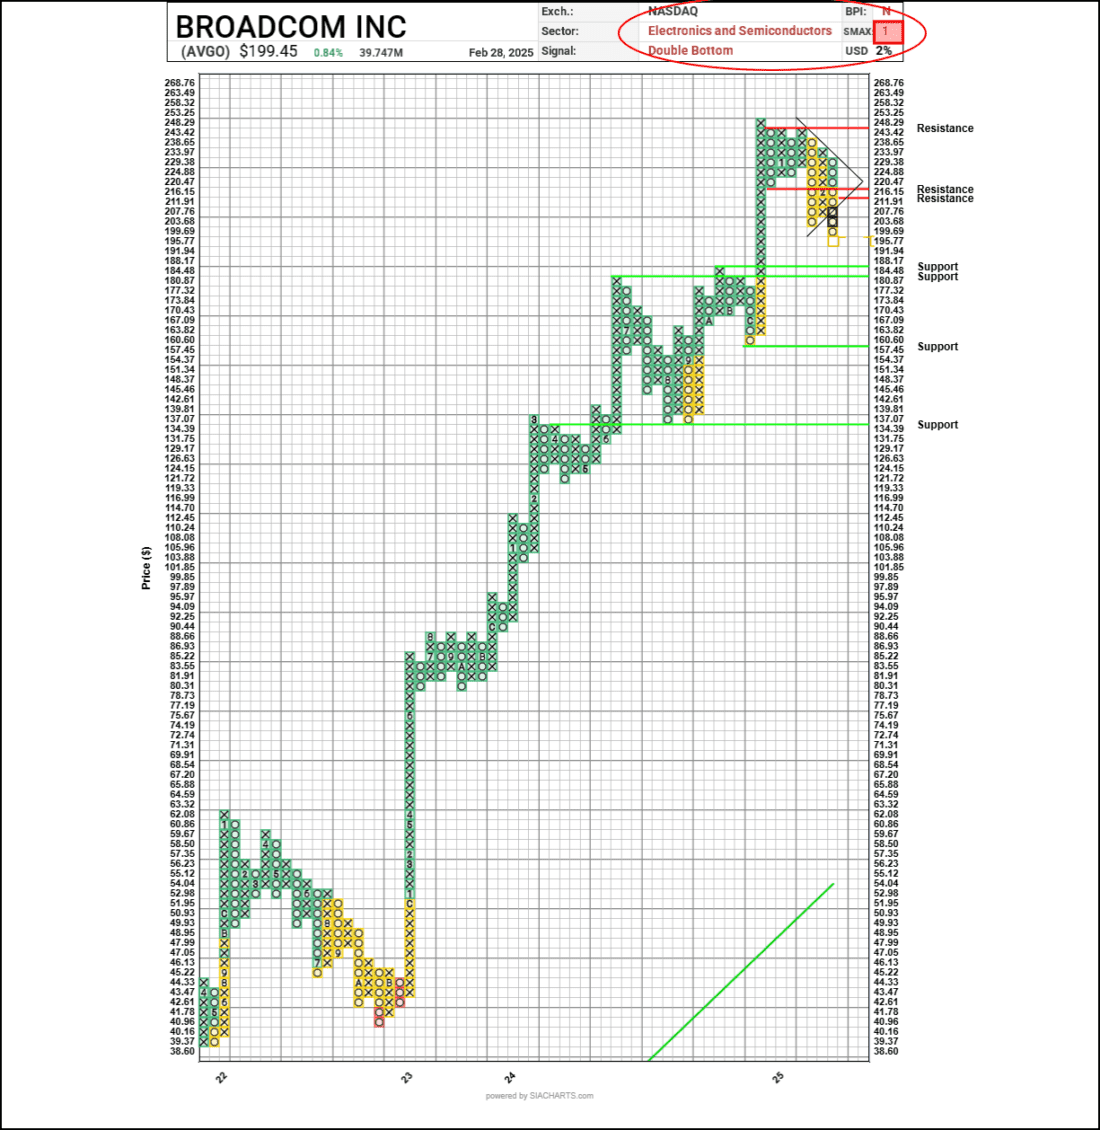
Technically, shares of AVGO also appear to have completed a point-and-figure (PNF) price discovery triangle (see thin black lines) on the attached PNF chart, which has been scaled at 2% for investment-grade analysis. Here, we see supply now back in control of the stock, just days ahead of its earnings report. Support on the PNF chart is now appearing at the $184.48 and $180.87 levels, with resistance at both the $216.15 and $220 levels. Beyond these tighter support and resistance levels, we have highlighted $157.45 and $134.39 on the support side, should supply continue to push prices lower and break through near-term support. On the other hand, should shares pivot to the demand side of the equation, top-level resistance is observable at the $248.29 level, a price obtained under near-perfect technical conditions when the semiconductor sector was running red hot with relative strength, and where AVGO was the “king of the castle.”
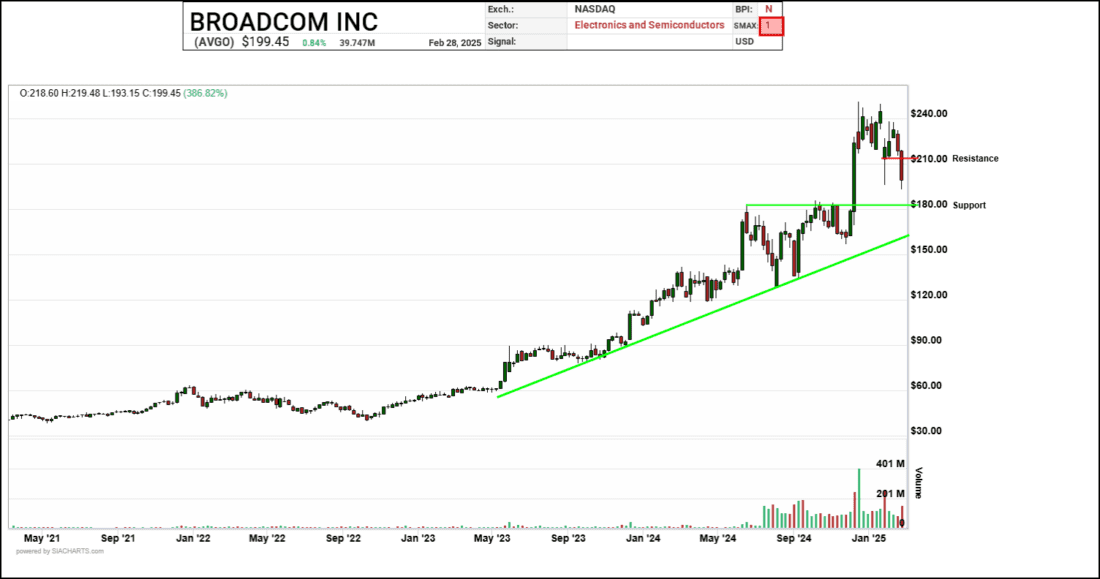
The second chart is a weekly candlestick chart that shows a similar picture, with shares running out of upward momentum at the $240 level, where wicks can be observed at the top of the candles over a period of 10 weeks. Now, shares appear to have broken support at $210 (now resistance), with the next level of major support in the $180 range, and longer-term trend support visible around the $150-$160 range. Again, this is against a backdrop of negative technical attributes in the Electronics and Semiconductor sector, and a very weak SMAX score of only 1/10, which, to SIA practitioners, is a near-term measure of relative strength against a basket of other asset classes, providing yet another vector of relative strength readings.
—
Originally posted 4th March 2025
Investopedia.com: The comments, opinions and analyses expressed herein are for informational purposes only and should not be considered individual investment advice or recommendations to invest in any security or to adopt any investment strategy. While we believe the information provided herein is reliable, we do not warrant its accuracy or completeness. The views and strategies described on our content may not be suitable for all investors. Because market and economic conditions are subject to rapid change, all comments, opinions and analyses contained within our content are rendered as of the date of the posting and may change without notice. The material is not intended as a complete analysis of every material fact regarding any country, region, market, industry, investment or strategy. This information is intended for US residents only.
Information posted on IBKR Campus that is provided by third-parties does NOT constitute a recommendation that you should contract for the services of that third party. Third-party participants who contribute to IBKR Campus are independent of Interactive Brokers and Interactive Brokers does not make any representations or warranties concerning the services offered, their past or future performance, or the accuracy of the information provided by the third party. Past performance is no guarantee of future results.
This material is from Investopedia and is being posted with its permission. The views expressed in this material are solely those of the author and/or Investopedia and Interactive Brokers is not endorsing or recommending any investment or trading discussed in the material. This material is not and should not be construed as an offer to buy or sell any security. It should not be construed as research or investment advice or a recommendation to buy, sell or hold any security or commodity. This material does not and is not intended to take into account the particular financial conditions, investment objectives or requirements of individual customers. Before acting on this material, you should consider whether it is suitable for your particular circumstances and, as necessary, seek professional advice.
Related Articles


Join The Conversation
For specific platform feedback and suggestions, please submit it directly to our team using these instructions.
If you have an account-specific question or concern, please reach out to Client Services.
We encourage you to look through our FAQs before posting. Your question may already be covered!