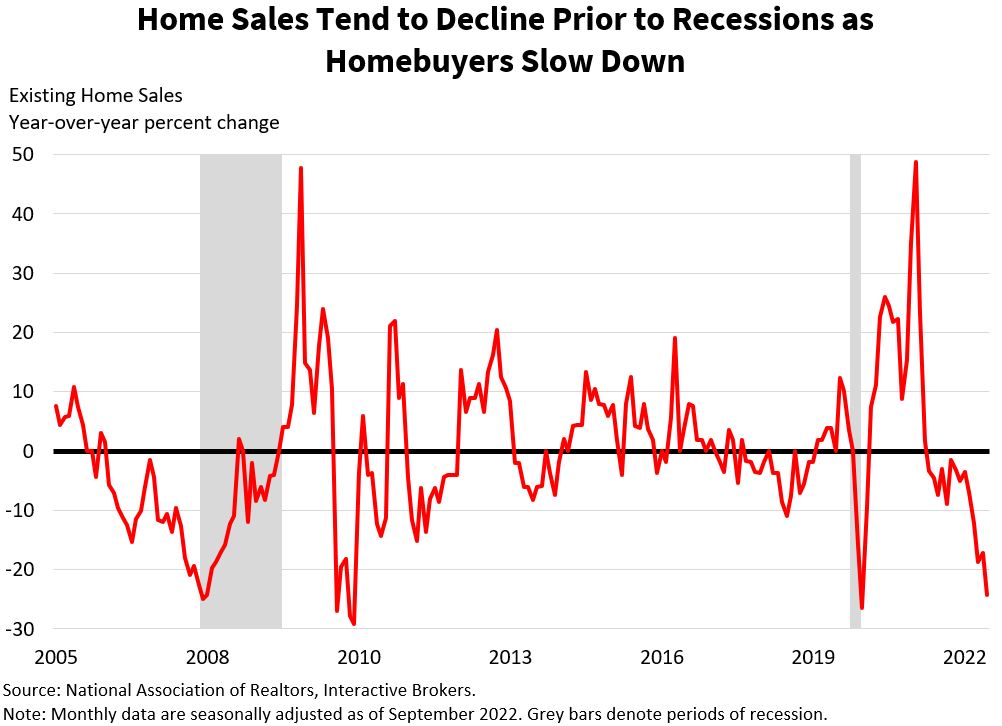
Home ownership is a large part of the American dream as households seek to build wealth, enjoy cutting ties with landlords and benefit from the perceived permanence of having their names on property titles. For investors and economists, existing-home sales data issued by the National Association of Realtors (NAR) provides valuable insight into how many Americans are achieving home ownership while also pointing to the overall health of the real estate market, the strength of consumers and broad economic conditions.
Existing-home sales data measures both prices and the number of homes sold monthly. Existing homes represent approximately 90% of overall residential sales, so the category is considered to be a broad indication of the health of the real estate market. To be classified as an existing-home sale, a residential unit must have been occupied before being placed up for sale. The data includes condos, co-ops and single-family homes and is broken into West, Midwest, South and Northeast regions of the U.S. The reports include both average and median sales prices and data for the past 12 months as well as annual totals for the last three years. The data is seasonally adjusted to compensate for the seasonal nature of home sales with most sales occurring in the spring and early summer months. The National Association of Realtors releases the reports at 10 a.m. Eastern Time on or about the 20th of each month. The Association produces the data so that policymakers, local businesses and homebuyers can make informed decisions about real estate markets.
The data is helpful for understanding the strength of the real estate market and Americans’ capacity for buying homes.
Households often make decisions to purchase homes based, at least in part, on mortgage interest rates, so the data illustrate the impact upon buyers of interest rate changes that have occurred in the past. Additionally, the data is based on completed transactions. With the vast majority of sales involving mortgage financing, which takes 30 days or longer to finalize, the data reflects purchase contracts that may have been signed at least a month prior to transactions being completed.
Existing home sales data can help spot trends in real estate markets, such as if higher mortgage interest rates and real estate prices are sidelining potential homebuyers. Consecutive months of existing-home sales declines can point to a housing recession while an uptick in sales can imply that the real estate market is strengthening.
The data also tracks trends in home pricing, which is another strong indicator regarding the condition of the residential real estate market. For example, an increase in prices when the overall number of sales declines could imply tight inventory conditions, which can occur when homebuilders are apprehensive about the real estate market and curtail construction.
The COVID-19 pandemic illustrates how interest rates can influence home affordability and sales activity. The pandemic resulted in record-low interest rates as the Federal Reserve pumped liquidity into the economy to fight the economic downturn resulting from measures to contain the virus. Many households fled the nation’s largest cities for less densely populated areas. These developments propelled sales to levels only reached prior to the 2008 financial crisis. Strong demand for household items for making home offices as remote work became the norm accompanied this trend. Slowing sales activity, on the other hand, is typically an indication of underlying weakness in the economy and reflects one or more of the many variables that influence the real estate sector. If the real estate market slows in the U.S. like it did during the 2008 financial crisis when sales declined dramatically, the information will likely reflect slowing economic growth and weakness across many economic data points.
 The desire for homebuilders to supply housing, demand for housing from consumers and the cost of capital and materials are important variables to analyze when assessing real estate markets. To forecast existing home sales, look at homebuilder sentiment, expected credit conditions, mortgage applications and daily commodity prices to get an idea of how builders, banks, consumers and investors feel about the trajectory of the real estate market. Also, look at the price action and listen to the conference calls of some of the largest real estate builders, operators and providers. KB Home, Toll Brothers, Lennar, DR Horton, AvalonBay, Equity Residential, Essex Property Trust, Builders FirstSource, Lowe’s and NVR are some to pay attention to.
While not typically a market moving data release, existing home sales are correlated with the economy, so the information can influence investor sentiment. With the exception of times of high inflation and fears that the economy is overheating, stronger-than-expected sales can support enthusiasm for capital markets while worse-than-expected results can hurt investor sentiment.
Buying a home is one of the most significant transactions most individuals will undertake and tracking the capital intensive and interest rate sensitive real estate sector is an important aspect of economic analysis.
Additional Resources


Join The Conversation
For specific platform feedback and suggestions, please submit it directly to our team using these instructions.
If you have an account-specific question or concern, please reach out to Client Services.
We encourage you to look through our FAQs before posting. Your question may already be covered!