The Discover Tool is a dedicated research area used to house tools from selected research providers. The Tool is available within TWS, Client Portal and Mobile TWS. Access within TWS using the New Window button to the upper left corner of the screen. Under the Information System area, locate and hover above the Discover label. Available research is displayed within the expansion menu. Select Trading Central to open a standalone window. Along the top of the Discover Tool window are six labels. Each tab enables the user to drill down within certain asset classes to find tradable ideas using pattern-recognition and additional research software.
- Market Buzz
- Technical Insight
- Technical Views
- Featured Ideas
- Fundamental Insight
- Economic Insight
Market Buzz
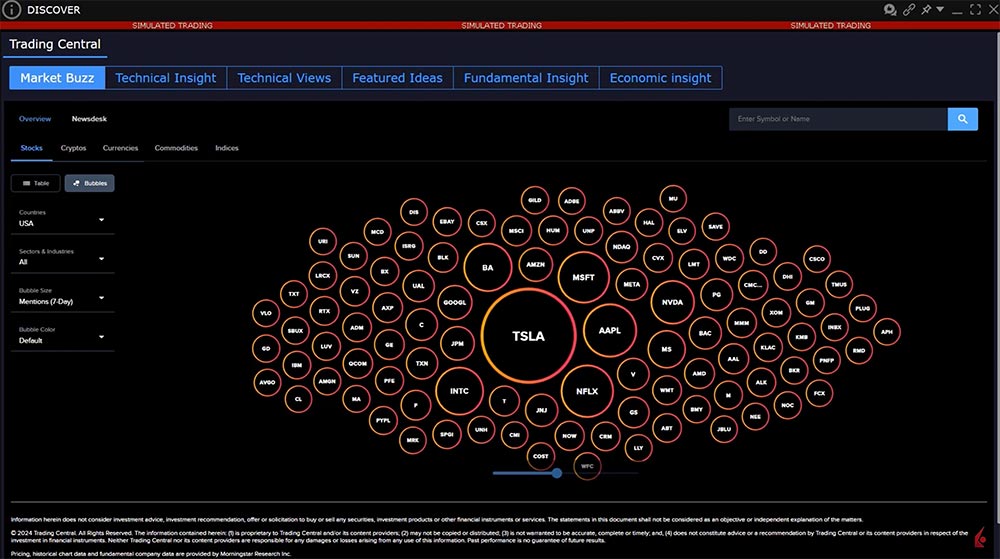
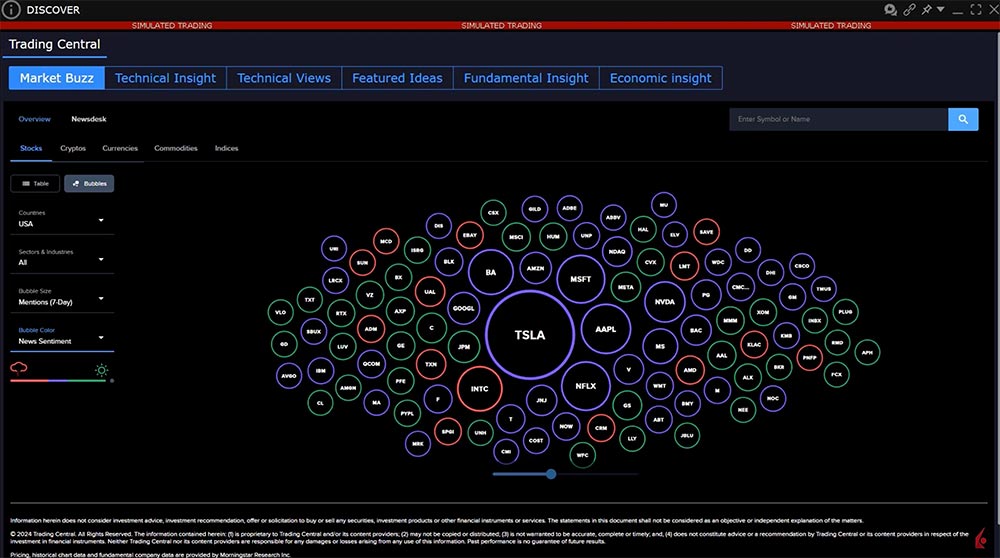
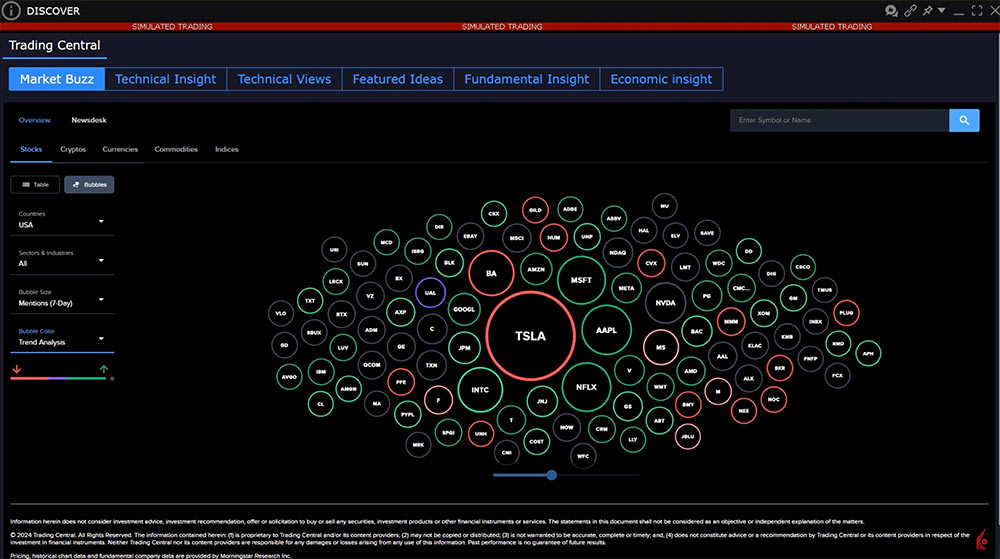
The default display shows Market Buzz, which displays in Table or Bubble format the most actively mentioned stock, cryptocurrency, currency pair, commodity or index. Click Table or Bubble to change the display. In this example, the Bubble menu is selected with Stocks targeted for the asset class. Click other asset classes. Each bubble describes a stock. The size of each stock is driven by the number of mentions within the defined period. The larger the bubble, the more media mentions. The user can determine countries, sectors and industries, the periodicity (driving the size of the bubble) and the color of the bubble. The user can choose here between News Sentiment and Trend Analysis.

Using the Default view, when the user hovers over any bubble, the display shows the company name and symbol and the number of mentions.
Switch to News Sentiment to see the bubble becomes color coded: Red for very negative, blue for neutral and green for very positive. Hovering above the bubble allows the user to see default information plus sentiment score and ranking. The user can quickly see stocks with the most buzz and whether the buzz is positive or negative.

Switch to Trend Analysis to view Trading Central’s trend sentiment ranking for each stock. Again, this is color-coded with red indicating likelihood of potential decline, blue indicating stable and green indicating potential price increase. Hover above a bubble to see name, symbol, media mentions and direction and magnitude of potential price change.

Use the zoom toggle beneath the display to change the universe displayed. The universe may contain stocks in which the user is interested. Users can either click any bubble to drill down into the Trading Central news and sentiment analysis. Or the user can enter any symbol of interest into the search bar to the upper right of the display.
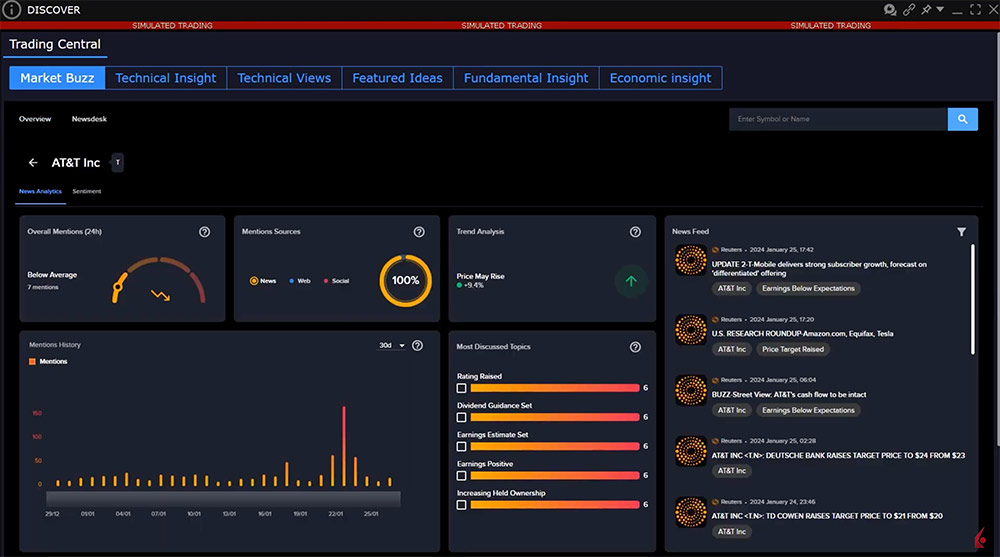
When the user drills down into an individual names, the display returns five panels, plus a configurable news feed to the right from Reuters. Each panel contains a hover-over question mark with explanation of each box.

Overall Mentions allows the user to see at a glance whether the number of media mentions is greater or less than an average. The Mentions Source depicts whether each item comes from a newsfeed, a website or a social feed.
Trend Analysis distills technical views of the asset and offers users predictive guidance of a scenario. The Trend Analysis may show the magnitude of a projected change in price. Click through the tab to open a side panel displaying a chart containing moving averages and pivot points used to determine the prevailing trend and anticipated price change. Notice the summary above the chart, with additional technical information below including a series of anticipated support and resistance levels. Use the X to the upper right to close this panel.
The Most Discussed Topics panel breaks down the mentions into trending topics contained within media focus for a name. Click a topic to add it to the news panel to its right. If the news mention was within a Reuters article, the story will populate enabling the user to drill down into the story.
Deselect topics from the News Feed to return to the default view. Click an article to expand and view it. Use the X button to the upper right to close each article.
To return to the Bubble view, click the arrow to the left of the company name.
Summary
The Market Buzz tab within Technical Insight quickly allows the user to see which stocks are being most talked about within various forms of news. This part of the software provides quick and easy way to see the immediate trend with the software identifying support and resistance levels for the investor to monitor. Use the additional tabs to access similar information for Crypto, Currencies, Commodities and Index products.
Resources


Is the News Sentiment number based on purely the news subscriptions one has, or a summary of all news providers (whether subscribed or not)? For example, I see AAPL right now is the most mentioned stock, with 210. Is this 210 mentions based on the news subscriptions I have?
Hello, thank you for asking. The News Sentiment number is based on all the news feeds IBKR has. We hope this answers your question!
how can you add some of your findings to your favorite list, like the heard on other places?
Hello, thank you for reaching out. To save an article for later reading:
Click on the article to open it
Click the “Read Later” icon near the top right
This will save the article and add it to your Read Later list.
To access news articles saved for later reading in TWS:
Click on the “News” icon to open the News panel
Select the Read Later tab
This will display a list of news articles you have saved for later reading. You can click on any article to open and read it.
We hope this helps!