
- Solve real problems with our hands-on interface
- Progress from basic puts and calls to advanced strategies
Interactive Options Course
Posted June 2, 2026 at 11:45 am
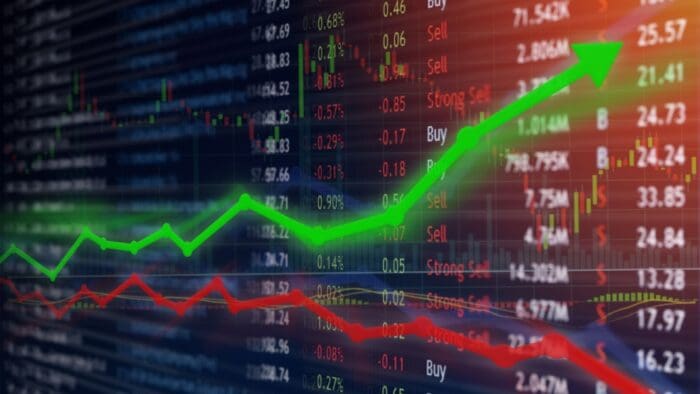
I have growing anecdotal evidence that some investors think the market advance is too good to be true. That’s largely based on conversations with friends and family. But it really struck me when several people felt the need to show me that a prominent financial TV host warned that one day we’ll have a crash.1 That’s hardly news. All cycles end. That same pessimistic host also acknowledged that we don’t know when.
A quick scroll through my business-related social media feed reinforces the point. The usual pessimists are out in force, arguing that an inflation spiral is here, rates will keep rising, and the US debt story is finally unraveling. The long-awaited moment for the permabear has arrived. Or has it?
Compounding the skepticism is the nearly 200% two-month rise in the stock of a prominent memory-chip company,2 helping to drive an 18.5% gain in the S&P 500 Index over the same period.3 To some, it feels unsustainable. Never mind that the company is only trading at 10x forward earnings.4 Compare that to the 18 prior periods when the S&P 500 rose by 18.5% or more over a two-month span. Returns were positive over the following six months in 16 of those instances, with an average gain of 10.6%.5 Sometimes facts get in the way of the naysayers’ good story.
The skeptics will be right eventually. They usually are at some point. The issue is timing, and I think it’s likely not now. What makes the current pessimism particularly puzzling is that it’s happening at a moment when key macro pressures appear to be easing. Oil prices, interest rates, and inflation expectations have all shown signs of peaking.6 Yes, the most recent 3.3% core Personal Consumption Expenditures (PCE) reading moved in the wrong direction,7 but markets were already aware of that. We’ve also already seen the Federal Reserve (Fed) rate cuts priced out with little disruption.8
More importantly, the inflation breakeven has been drifting lower.9 Markets appear increasingly comfortable with the idea that inflation isn’t reaccelerating in a meaningful way. Geopolitical uncertainty remains. We don’t know the resolution of the Iran war or the path for the Strait of Hormuz. But markets tend to discount outcomes well before they’re realized, and there’s a growing belief that these risks will eventually stabilize.
So, what are the naysayers missing?
First, earnings. US corporate earnings grew by 28% in the first quarter, well above the mid-single-digit expectations.10 Prices haven’t climbed at the same pace, meaning valuations have fallen.11
Second, the discount rate. Markets have already adjusted to a less accommodative Fed path. Inflation expectations have generally been moving lower in recent days,12 and it’s difficult to see the Fed raising rates in this environment.
Strong earnings growth alongside a Fed that’s on hold is a constructive combination in my view. If oil prices and interest rates continue to move lower together, it could also support a broadening in market leadership.
The pessimist often sounds smart. The narrative is compelling. Yes, this cycle will end. It always does. But it typically doesn’t end with credit spreads tightening13 and inflation expectations falling.14 The permabears will eventually have their moment and likely remind everyone that they were right. But when it arrives, markets may be higher than they have been today.
| Date | Region | Event | Why it matters |
|---|---|---|---|
| June 1 | US | ISM Manufacturing Index (May) | Key gauge of factory activity and business conditions across the US economy |
| China | Caixin Manufacturing Purchasing Managers’ Index (PMI) (May) | Early read on factory activity and export demand | |
| Japan | Manufacturing PMI (final) | Momentum in Japan’s industrial sector and global trade exposure | |
| Eurozone | Manufacturing PMI (final) | Manufacturing health across the region and broader growth trends | |
| UK | Manufacturing PMI (final) | Provides insight into business activity and domestic demand conditions | |
| Eurozone | Unemployment rate (April) | Labor market strength, a key driver of consumer spending | |
| June 2 | Eurozone | Consumer Price Index (CPI) flash estimate (May) | Key inflation measure that shapes European Central Bank policy expectations |
| June 3 | China | Services PMI (May) | Indicates strength of consumer-facing sectors and domestic demand |
| US | ADP Employment Report (May) | Early read on private-sector hiring ahead of official jobs report | |
| US | Factory orders (Apr) | Manufacturing demand trends and momentum | |
| US | ISM Services Index (May) | Services sector activity, which drives most of US economic growth | |
| June 4 | US | Productivity (Q1) | How efficiently businesses are producing goods and services, with implications for inflation |
| June 5 | US | Employment report (May) | Closely watched labor market release, shaping expectations for growth and interest rates |
| US | Consumer credit (Apr) | Borrowing trends and consumer spending strength |
—
Originally Posted June 1, 2026
What stock market pessimists may be missing by Invesco US
Important information
NA5531731
All investing involves risk, including the risk of loss.
Past performance does not guarantee future results.
Investments cannot be made directly in an index.
This does not constitute a recommendation of any investment strategy or product for a particular investor. Investors should consult a financial professional before making any investment decisions.
The ADP Employment Report measures nonfarm private payrolls. It’s published monthly in collaboration with Moody’s Analytics.
The Bloomberg US Corporate Bond Index measures the investment grade, fixed-rate, taxable corporate bond market. It includes US dollar-denominated securities publicly issued by US and non-US industrial, utility, and financial issuers.
The Consumer Price Index (CPI) measures the change in consumer prices and is a commonly cited measure.
Credit spread is the difference in yield between bonds of similar maturity but with different credit quality.
A discount measures how much less one stock (or index) is trading compared with another stock (or index).
Earnings per share (EPS) refers to a company’s total earnings divided by the number of outstanding shares.
The federal funds rate is the rate at which banks lend balances to each other overnight.
Forward earnings per share is a variant of earnings per share and is calculated using a company’s projected earnings over the next 12 months divided by the number of outstanding shares.
A flash estimate is an early estimate for an economic data point.
Gross domestic product (GDP) is a broad indicator of a region’s economic activity, measuring the monetary value of all the finished goods and services produced in that region over a specified period of time.
Implied futures rates are the specific interest rates that financial markets expect, or imply, will occur in the future, calculated from the prices of interest rate futures and forward contracts.
Inflation is the rate at which the general price level for goods and services is increasing.
The ISM Manufacturing Index is based on Institute of Supply Management surveys of manufacturing firms in the US and monitors employment, production, inventories, new orders, and supplier deliveries.
A market cycle is a trend or pattern that may exist in a given market environment, allowing some securities or asset classes to outperform others.
Monetary easing refers to the lowering of interest rates and deposit ratios by central banks.
Option-adjusted spread (OAS) is the yield spread that must be added to a benchmark yield curve to discount a security’s payments to match its market price, using a dynamic pricing model that accounts for embedded options.
Personal consumption expenditures (PCE), or the PCE Index, measures price changes in consumer goods and services. Expenditures included in the index are actual US household expenditures. Core PCE excludes food and energy prices.
Purchasing Managers’ Indexes (PMI) are based on monthly surveys of companies worldwide and gauge business conditions within the manufacturing and services sectors.
The S&P 500® Index is an unmanaged index considered representative of the US stock market.
A spread in finance is the difference between two related values, such as prices, rates, or yields.
West Texas Intermediate (WTI) is a type of light, sweet crude oil that comes from the US.
In general, stock values fluctuate, sometimes widely, in response to activities specific to the company as well as general market, economic, and political conditions.
The opinions referenced above are those of the author as of May 29, 2026. These comments should not be construed as recommendations, but as an illustration of broader themes. Forward-looking statements are not guarantees of future results. They involve risks, uncertainties, and assumptions; there can be no assurance that actual results will not differ materially from expectations.
This does not constitute a recommendation of any investment strategy or product for a particular investor. Investors should consult a financial advisor/financial consultant before making any investment decisions. Invesco does not provide tax advice. The tax information contained herein is general and is not exhaustive by nature. Federal and state tax laws are complex and constantly changing. Investors should always consult their own legal or tax professional for information concerning their individual situation. The opinions expressed are those of the authors, are based on current market conditions and are subject to change without notice. These opinions may differ from those of other Invesco investment professionals.
NOT FDIC INSURED
MAY LOSE VALUE
NO BANK GUARANTEE
All data provided by Invesco unless otherwise noted.
Invesco Distributors, Inc. is the US distributor for Invesco Ltd.’s Retail Products and Collective Trust Funds. Institutional Separate Accounts and Separately Managed Accounts are offered by affiliated investment advisers, which provide investment advisory services and do not sell securities. These firms, like Invesco Distributors, Inc., are indirect, wholly owned subsidiaries of Invesco Ltd.
©2024 Invesco Ltd. All rights reserved.
Information posted on IBKR Campus that is provided by third-parties does NOT constitute a recommendation that you should contract for the services of that third party. Third-party participants who contribute to IBKR Campus are independent of Interactive Brokers and Interactive Brokers does not make any representations or warranties concerning the services offered, their past or future performance, or the accuracy of the information provided by the third party. Past performance is no guarantee of future results.
This material is from Invesco US and is being posted with its permission. The views expressed in this material are solely those of the author and/or Invesco US and Interactive Brokers is not endorsing or recommending any investment or trading discussed in the material. This material is not and should not be construed as an offer to buy or sell any security. It should not be construed as research or investment advice or a recommendation to buy, sell or hold any security or commodity. This material does not and is not intended to take into account the particular financial conditions, investment objectives or requirements of individual customers. Before acting on this material, you should consider whether it is suitable for your particular circumstances and, as necessary, seek professional advice.
For specific platform feedback and suggestions, please submit it directly to our team using these instructions.
If you have an account-specific question or concern, please reach out to Client Services.
We encourage you to look through our FAQs before posting. Your question may already be covered!
Related Articles


")


Sorry but you are discounting the last inflation read which was extremely hot, GDP revised down in big way to 1.6, and a consumer that is on life support. Not to mention valuations at ATHs. Price /sales, Price/book, Cape Schiller, Buffet, Equity Risk premium. Delinquencies across the board are exploding! Car loans, student loans, credit cards, home mortgages, commercial real estate!!! Your are delusional
Looks like you’ve managed to trigger your first perma-bear in the first comment. They uttered the magic name “Buffet” (who moved to cash back in 2023 and missed the entire bull run that followed. The thing about perma bears and nay-sayers is they only need to be right once. The problem is they are almost never right in the specific time frame they’re predicting, and when the market doesn’t crash, they sort of back off and wait – then months or years later, they always say “I predicted that!” You do make a decent Bull case, though. No one can time the market. Period. The end.
I have heard we are headed for a crash for 4+ years. I can’t count the number of times, the AI trade was in imminent risk of failing, yet the commenters failed to illustrate any conviction or they would be shorting the market and getting crushed. Words are free, but conviction costs money; Exhibit A is Burry and his (thus far) incorrect assessments- leading to a sting of massive losses. Easy to say we are headed for a crash when you don’t provide a timeframe. Time will tell but I see this bull market, especially in technology, continuing through 2026 and have put money behind my predictions.
many were calling it a bubble back in late 2023 into 2025. I held steady with my AI investments which I had since 2020. On April 3 of 2025, the everyone was saying the correction was the first sign of the bubble deflating. I held my nose and bought more Nvidia and TSM at a nice discount. Panic never helps and always makes things worse.
Please believe me that this question is not meant to be argumentative. I really want to know your strategy. What conditions would lead you to not buy the dips, and perhaps sell into them? Do you decide that company-specific fundamentals have deteriorated enough that prospects are unattractive before selling or passing up dips? Do you use some different or additional metrics in your decisions to sell or restrict additional purchases? ……….. Thanks……. Houyhnhnm
Nvidia and TSM are the entirety of my AI investments which I bought in 2020. I thought about Micron about a year ago (when it was at around 110 per share), but passed on that. Now I’m regretting it. I would sell at least 1/2 of any Micron position I bought once it went 10x. I feel like Micron just went way too parabolic, too fast. I stopped accumulating Nvidia and TSM April of 2025, and have trimmed those by about 10% over the last 6 months, which got my initial investment plus 50% back. I do invest based on fundamentals. Nvidia and TSM look like the safest investments in the AI space. TSM has geopolitical risks attached, based on China’s designs on Taiwan, so I consider that as well. I have other investments in other sectors.
> US corporate earnings grew by 28% in the first quarter I’m more a technical trader than a fundamental investor, so I don’t follow these things closely, but it seems to me that rate of corporate earnings growth is not sustainable for long if we’re not coming out of a recession. Any fundamental bulls here have a reaction to this suggestion?
Hmmm, the comment window seems to be ignoring my paragraph breaks….. Anyway…… > 18 prior periods when the S&P 500 rose by 18.5% or more over a two-month span. Returns were positive over the following six months in 16 of those instances, with an average gain of 10.6%.5…………… Thanks for this nugget of data. I always like confirmation of my trend-following philosophy. (Yes, I know every trend ends in unpredictable and sometimes violent fashion, and long-term buy-and-holders will have their superior years.)