
- Solve real problems with our hands-on interface
- Progress from basic puts and calls to advanced strategies
Interactive Options Course

Posted August 13, 2026 at 1:08 pm
This morning’s cooler-than-expected PPI is sending stocks to the nosebleeds and pushing yields south as the second tame inflation print in as many days is propelling animal spirits. Softening price pressures have quelled rate-hike fears in the past two sessions with Fed watchers yesterday delaying the projected start of the central bank’s tightening from September to October and then extending it today to December. The S&P 500 and Russell 2000 indices have leaped to fresh records amidst broad participation featuring 9 of the 11 principal sectors advancing. The decelerating cost forces are dramatically loosening financial conditions as the Treasury curve plunges by roughly 7 basis points throughout maturities while the greenback weakens on increasingly dovish monetary policy prospects against the backdrop of sinking inflation expectations. Modestly hotter-than-anticipated initial unemployment claims that have risen above 200k for the first time in four weeks additionally helped fixed income, albeit to a much lesser extent than the wholesale publication. Geopolitics remain a headwind, of course, as Washington and Tehran have yet to make tangible progress on a deal, however, investors don’t seem to care about WTI hovering around $80 per barrel, as the energy shock has been contained despite grave threats of undersupply. In other areas, commodities are still lower across the board even as risk-on sentiment has cryptocurrencies and prediction markets catching bids. Elsewhere, volatility protection instruments are relatively unchanged as Wall Street goes on offense.
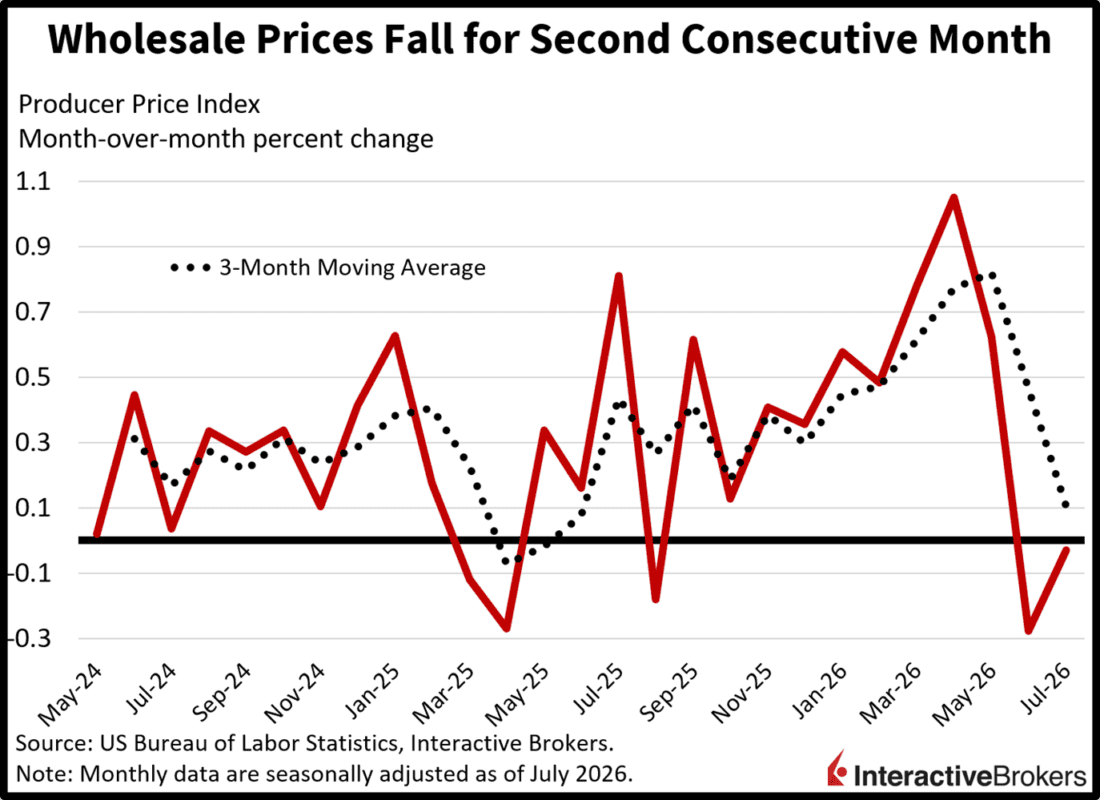
Wholesale costs dropped for the second consecutive month in July, as cheaper commodities and slower increases elsewhere drove a massive deceleration in gate price pressures. The Producer Price Index (PPI), while easing to a 4.7% year-over-year (y/y) rate, was slightly negative month over month (m/m) but after rounding, it was flat. The results compare 5.5% y/y and -0.1% m/m in June, as well as 5.9% y/y and 0.5% m/m in May. Additionally, this morning’s publication fell below the 4.9% y/y and 0.2% m/m expectations. In July, 3.1%, 1.8% and 0.9% m/m decreases for energy, transportation/warehousing services and food contributed to the modest headline descent. It was the second monthly decline for those categories. Trade services, which slipped 0.1% in July, also helped drive the soft overall result. Conversely, other services and core goods bucked the broad deflationary trend, becoming 0.6% and 0.1% more expensive.
Unemployment claims remained well-anchored in the past two weeks as the labor market continues to reflect subdued layoff appetites. Initial filings rose to 209k during the week ended August 8, which exceeded the 202k median estimate and the previous period’s 200k. On a more positive note, continuing applications, which lag the first-time segment by seven days, slipped to 1.777 million from 1.799 million and were below the projected 1.8 million. Four-week moving averages were little changed at 199k and 1.786 million.
With both hiring and price pressures decelerating, bond bears are hanging on to fiscal deficits and heavy debt issuance as the prime reasons to try and justify today’s elevated yields. While term premiums and offering volumes are certainly important considerations when buying government credit, coupons above 5% at the long end of the curve are simply unreasonable in an environment of 2.5% core inflation, a number which matched a February print that was the lowest since March 2021. The paths for significant capital gains are indeed intact for duration, as slowdown risk, a further softening in cost forces and/or a deal between Washington and Tehran can drive a substantial plunge in interest rates. Additionally, equity investors seeking to take some profits in light of attractive double-digit year-to-date percentage returns from stocks and/or hedge portfolios by using fixed income as we approach September’s unfavorable seasonal dynamics can look to the longer maturities in the Treasury complex for a mix of portfolio appreciation possibilities alongside mitigation of potential stock market declines.
Japan’s Corporate Goods Price Index depicted gate prices climbing 7.2% y/y and 0.1% m/m in July, which were only minimal moderations from the 7.3% and 0.5% jumps in the preceding month. On a positive note, the indicators were cooler than the economist consensus expectations for y/y and m/m ascents of 7.4% and 0.6%. Strong demand for AI technology and supply disruptions caused by the Middle East crisis contributed to prices climbing across various categories. Non-ferrous metals and chemicals, for example, were up 40.6% and 12.9% y/y. The two categories also jumped 39.3% and 15.1% y/y in June. Within the m/m print, electric power, gas and water became 3.7% more expensive.
Second-quarter gross domestic product (GDP) in the UK was up 1.2% y/y but expanded only 0.4% on a quarter-over-quarter (q/q) basis, according to preliminary data from the Office for National Statistics. The annual number accelerated from 0.9% during the first three months of 2026 and narrowly outpaced the economist consensus estimate of 1.1%. Conversely, the q/q result, while meeting the economist consensus estimate, slowed from the 0.5% advance in the January through March period.
The UK’s industrial and manufacturing production slipped 0.2% and 0.5% m/m in June after posting 0.7% and 0.2% declines in May. Both results were disappointing with economists anticipating a 0.1% industrial production gain and only a 0.1% descent for manufacturing.
The UK’s trade deficit widened from GBP3.46 billion in May to GBP5.54 billion last month with the value of exports and imports falling 2.8% and 0.2%, respectively, m/m. Trading with the European Union was a headwind with goods exports sinking 7.4% m/m while imports slipped only 0.7%. The US somewhat bucked the trend. Exports to the US descended 4.9% but purchases of goods from the country fell 7.9%.
The euro area’s industrial production was flat m/m in June after heading north 0.3% in May. Economists anticipated a 0.1% slip. When compared to the year-ago period, however, industrial production was up 0.1%, a much better showing than the economist consensus estimate for a 0.8% contraction and May’s 0.1% drop.
New to Interactive Brokers?
Open AccountInformation posted on IBKR Campus that is provided by third-parties does NOT constitute a recommendation that you should contract for the services of that third party. Third-party participants who contribute to IBKR Campus are independent of Interactive Brokers and Interactive Brokers does not make any representations or warranties concerning the services offered, their past or future performance, or the accuracy of the information provided by the third party. Past performance is no guarantee of future results.
This material is from IBKR Macroeconomics, an affiliate of Interactive Brokers LLC, and is being posted with its permission. The views expressed in this material are solely those of the author and/or IBKR Macroeconomics and Interactive Brokers is not endorsing or recommending any investment or trading discussed in the material. This material is not and should not be construed as an offer to buy or sell any security. It should not be construed as research or investment advice or a recommendation to buy, sell or hold any security or commodity. This material does not and is not intended to take into account the particular financial conditions, investment objectives or requirements of individual customers. Before acting on this material, you should consider whether it is suitable for your particular circumstances and, as necessary, seek professional advice.
Related Articles

















Join The Conversation
For specific platform feedback and suggestions, please submit it directly to our team using these instructions.
If you have an account-specific question or concern, please reach out to Client Services.
We encourage you to look through our FAQs before posting. Your question may already be covered!