
- Solve real problems with our hands-on interface
- Progress from basic puts and calls to advanced strategies
Interactive Options Course

Posted August 13, 2026 at 10:35 am
What’s really hiding inside an options chain? Jeff Praissman and Mat Cashman of OCC explore how put-call parity, synthetic stock, interest rates, dividends, and borrowing costs can reveal an implied forward price – and why investors shouldn’t mistake it for a market forecast.
The following is a summary of a live audio recording and may contain errors in spelling or grammar. Although IBKR has edited for clarity no material changes have been made.
Hi, everyone. This is Jeff Praissman from Interactive Brokers. It’s my pleasure to welcome back to the IBKR Podcast Studio, Mat Cashman from the OCC. Hey, Mat, how are you?
I’m doing well, Jeff. How are you?
I’m doing great. Love having you come in for our informative podcasts and webinars. For our listeners, you can find more from Mat at theocc.com.
He does a lot of webinars, podcasts, and articles that you can see on our website as well at ibkr.com. Click on Education and go to The Campus. But today, Mat, we’re gonna talk about something that may surprise investors who, you know, normally look at option chains kind of as a collection of calls and puts.
But, you know, Mat, you say there’s effectively a stock price hidden inside the options market. What do you mean by that?
I mean when I say that, that call and put prices are not just floating around independently. They’re tied to each other, and they’re also tied to the stock. So if you take a call and a put with the same strike and the same expiration, the relationship between those prices can tell you a lot about what the options market is implying for the value of the stock at the expiration of those options.
And so it’s not necessarily a prediction. I wanna make sure we say that explicitly, like right out of the gates. I wanna get that out there early. It’s more of like a tradable relationship between the options. It’s the price at which the different pieces of the market are lining up. And once you account for things like time and rates and potential dividends and some other real world considerations, there’s absolutely a stock price that’s embedded in those option prices.
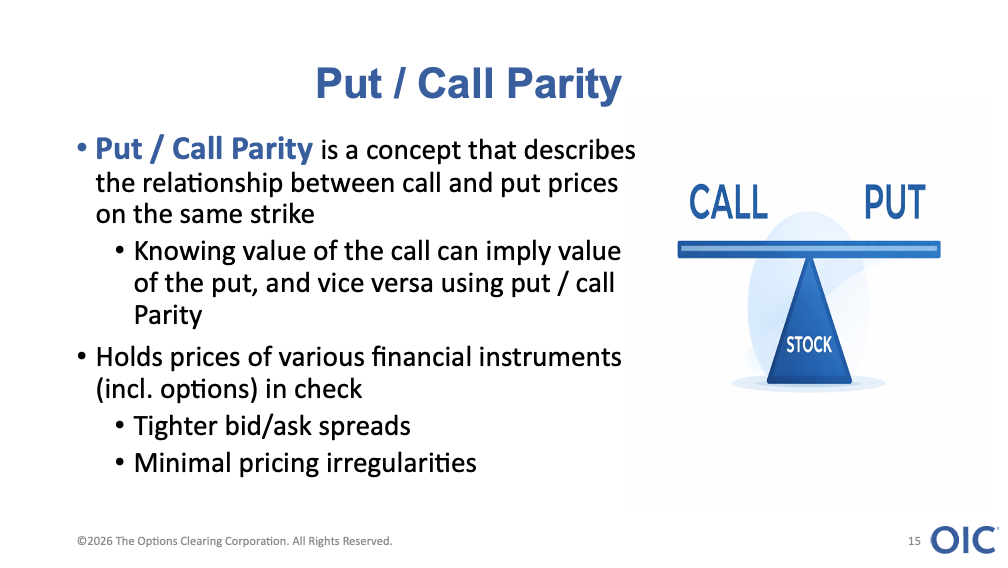
So Mat, let’s start with, you know, sort of that basic relationship you’re talking about. What is put call parity actually telling us?
A great place to start. Put call parity at its core is saying that a call and a put and the stock can all not be priced perfectly independently from each other. They’re all economically connected in some way. And so, you know, old option traders learn this very quickly because when we were trading options, particularly options on the same strike, if one of the legs got too far out of line, someone would inevitably come in and trade the entire package of the call, the put, and the stock against it as an arbitrage.
And you didn’t necessarily just sit there and admire the formula at work. You looked at the call, you looked at the put, you looked at the stock price, and you asked whether or not those prices added up at that moment in time. And if they didn’t add up, there was either an opportunity which we oftentimes called an arb or an arbitrage, or there was something that you had not accounted for. And that’s something that I wanna make sure we also transmit here, is that usually the second possibility, the part like there’s something that I haven’t accounted for deserves some serious consideration when you’re looking at things like this because it might be interest rate assumptions, it might be dividend assumptions.
The stock might be hard to borrow. One side of the options market might be super wide, and you might be looking at stale prices or something like that. But the basic idea remains the call, the put, and the stock, generally speaking, are tied together in their pricing.
And Mat, I just want to note, as old option traders, you know, we walked uphill both ways in the snow to the exchange when we were going to work every day. But on a serious note you just mentioned, you know, several inputs to the pricing model, right? Like dividends and interest and but this isn’t just some pricing model theory though, right?
No, it’s not just pricing model theory. The model helps you to describe it and look at it, but really what’s happening here is the market participants are the people who are kind of like enforcing it, for lack of a better term, right? If the synthetic version of the stock, the version of the stock that you can create by using the calls and the puts, becomes materially cheaper than the actual stock, traders have an incentive to buy one and sell the other. And if the synthetic version of the stock becomes materially more expensive, they can look at doing the opposite, right? They could sell the synthetic stock and buy the actual physical stock against it. And that trading is what keeps the relationship reasonably tight and tied together. It’s not perfectly tight. Markets are never perfectly clean. But it’s tight enough that the options can tell us something meaningful about where the forward value of the stock is being implied.
And even before we go any further, I think, you know, obviously a lot of people listening to this podcast are experienced option traders, but we also, you know, get a lot of people that are kind of exploring options for the first time or maybe not as experienced. So I think it would make sense, Mat, if you could just sort of explain what you mean by synthetic stock, just so our listeners are kind of all on the same page.
And then we can kind of get into, you know, calculating the hidden price after that.
Yeah, absolutely. So a synthetic position, a synthetic stock position in this case when we’re talking about it that way, is just a combination of instruments that recreates the general payoff of the original instrument. So in this case, we’re talking about synthetic stock. If you’re looking at long synthetic stock, you’re essentially buying a call and selling a put on the same strike in the same expiration. So both of those positions are what we call long delta. Long a call is long delta, short a put is also long delta, and when you put them together at expiration, that expiration payoff diagram behaves a lot like long stock, and it’ll look an awful lot like long stock looks. And this is one of those concepts that becomes much easier once you look at the actual payoff diagram.

Above the strike of those options, the long call is doing the work of creating that long delta position. Below the strike of those options, the short put in that position is doing the work of giving you the long delta. But no matter which direction the stock moves above or below the strike, the combined position produces a stock-like, a stock-like payout diagram. And that’s why I think about it as like the call and the put together are a new or a different version of the stock. They’re synthetic stock. And so it’s also important to make sure people understand it’s not operationally identical to owning stock. There are many considerations you have to have. These are actually option positions, so you need to think about margin considerations, assignment possibility, and expiration, particularly if you’re gonna carry this position through its expiration. But economically, that same strike call and put package that we’re talking about is what creates the directional profile of the stock.
And obviously like short call and long put, same expiration would be the synthetic short stock.
Yeah, exactly. So if you’re selling the call and buying the put on the same strike in the same expiration, now you have synthetic short stock, whereas being long the call and short the put, you would have synthetic long stock. Here, when you’re talking about synthetic short stock, it’s the exact opposite.

Both of the positions are short delta. The short call is short delta. The long put is short delta. And as you’re below the strike, right, the long put is what’s doing most of the heavy lifting as far as giving you short delta. And if you’re above the strike, the short call is doing the heavy lifting there. But once you kind of accept the fact that both calls and puts can be put together in that way to create a stock-like exposure, the next step obviously always is the next step. Sometimes the primary step becomes fairly intuitive, right? Like, what price am I creating this synthetic short stock position, right?
At what price am I doing this? So
That was a great explanation of the synthetics for our listeners, Mat, so thank you for that. So now that we kind of crossed that bridge let’s get into the, you know, the hidden stock price calculation. Can you walk us through that, please?
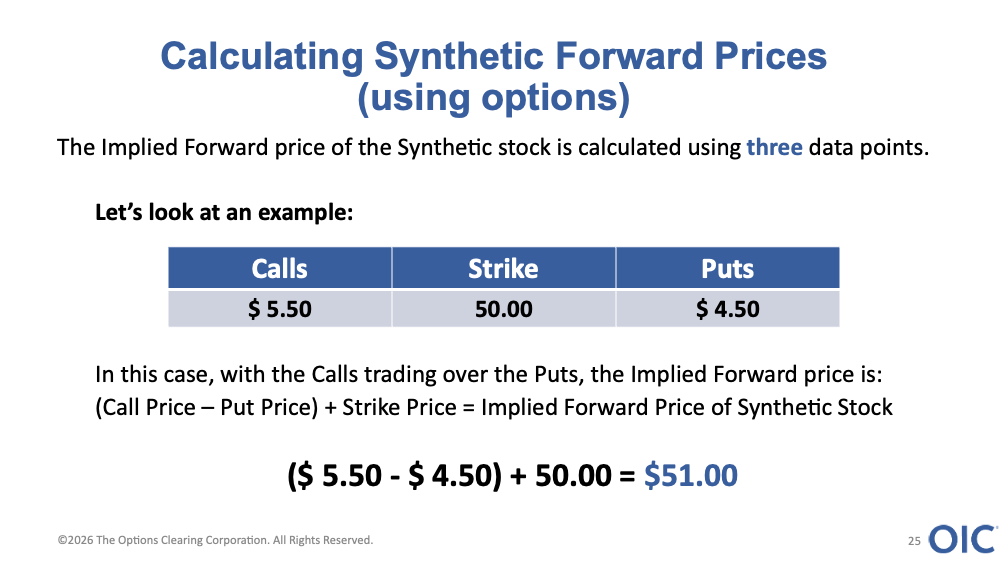
Yeah. So let’s talk about how you actually price it. You take a call and a put with the same strike and the same expiration, right? That’s the most important part here. Same strike, same expiration. That keeps those things linked together in that concept of put-call parity like we talked about as closely as possible. What you do is you subtract the put price from the call price, and then you add the strike of those options to that equation. So call minus put plus the strike equals the implied forward price of the synthetic stock that you’re looking at.

So let’s say, for example, that we’re looking at the 50 strike call and the 50 strike put. If the call and the put are worth exactly the same, the implied forward is 50 because you’re doing those two options equal zero when you subtract one from the other, you add the strike, which is 50, and you get 50. If the call is trading over the put, meaning the call is worth more than the put is, the implied forward price is going to be above 50. And if the put is trading over the call, the implied forward price is going to be below 50. And so that’s the very basic arithmetic of how you put that thing together.
So Mat, I wanna ask you something because we just talked about synthetic stock, but you very clearly said, you know, implied forward is 50 or above 50 or below 50. Why are you calling it a forward price rather than just simply calling it the stock price?
That’s a good question. The main reason why is because the options expire at some point in the future. And so if we’re looking at and using options that are expiring 30 days from now, if these are 30 DTE options, the relationship between the call and the put on that 30 DTE option is telling us about the synthetic stock value associated with that date, those 30 days from now.
And so the current cash stock, the actual stock, the physical stock might be trading $50, but the 30-day implied forward that we’re talking about getting from the call and the put together might show $50.20, or it might show below the strike. It might show $49.70. That difference between where the stock is actually trading, the physical stock right now, and the actual implied forward price can reflect all of those things that I talked about at the beginning.
The cost of carrying the stock, possible expected dividends, borrow conditions, and the remaining time that exists in these options between now and the time that they expire. So it is kind of like a stock price, but it’s a stock price for a future point, and that’s why we call it, you know, an implied future price.
Gotcha. So it can behave like a stock, but like as you discussed before, it’s not a stock and there’s some significant differences with some of the items that separate options from stock.
Yes, absolutely. All of those things still hold true, right? These are options that you’re trading. They pay out like a stock price, but they are options positions. You need to keep that in mind too.
All right. So Mat, let’s kind of take an example, and for our listeners that are watching this on YouTube, there should be some slides that appear. But I’ll kind of, you know, say it out loud as well for our listeners driving in a car and cannot look. So let’s take, you know, let’s say 50 strike, and let’s say the calls are priced at $5.50 and the puts are priced at $4.50. So can you kind of walk our listeners through these three data points and how they are used to calculate the pricing?
Yeah, absolutely. So to reiterate what Jeff just said, the example we’re looking at is the call trading $5.50 and the put trading $4.50 cents and $5.50 cents. So the call is worth $1 more than the put. So we take $5.50, the call price, you subtract $4.50, the put price from it, and then you add the strike of those options, which is the $50 strike. That gives us an implied forward price of $51. That’s $5.50 cents minus $4.50 cents. Those are the two options. That’s a buck. And then you add the strike price of 50, that gives you 51. And so the options package here, the call and the put combined, is effectively pricing the synthetic stock at $51 for that expiration, even though the actual physical stock at that moment in time is trading 50 bucks.
Now, I don’t want anyone to look at this and immediately say, “The options market is predicting that the stock is going up to 51,” right? That is not how we want to use this right off the bat. That is a place where people can definitely get off the rails as far as this is concerned. What it does mean is that the forward relationship currently clears around 51 bucks. Part of that could represent the cost of financing through the time that these options expire. Part of it could reflect dividends. The important part is that 51 right now is the price implied by those two options and the relationship between those two options.
It’s really closer to like an arbitrage relationship than a directional forecast, correct?
Yeah. That’s generally definitely how I would frame this. A forecast is really someone saying, “I think the stock’s going to 51 for these reasons,” right? An implied forward is the price around which the cash stock right now and the synthetic stock economically line up and why there might be a difference between them.
There are, you know, and those two things are different statements. The forecast is way different than it– I mean, the forecast might contain some of the same market information, but I would advise people not to turn that into something that it’s not. What we’re looking at is economic difference between synthetic stock and the actual physical stock at this moment in time.

So Mat, let’s run through one more example. Let’s just go with, you know, 50 strike. This time, though, the call is a $1.50 and the put is $4.50.
Yeah. So the previous one we looked at, right, the call was trading over the put, meaning that it was implying that the forward implied price of the stock was higher than the strike. In this case, the exact opposite is true. The put is worth $3 more than the call. So a $1.50 minus $4.50 gives you negative three bucks, and then add that 50 strike again. That gives you an implied forward price of 47 that is below the strike of the options. And that is actually played out in how those options are priced, right? The put is worth $3 more than the call, and that usually tells you that the stock is trading below the strike. Not always, but most of the time it does.
Again, that does not automatically mean the market has, you know, placed some sort of bearish $47 price target on this stock. It tells you that the way the options are priced right now are currently implying the synthetic relationship to be around 47 bucks for that expiration specifically. And so the next question inevitably that people ask is why? Why is that different than the actual cash price of the stock right now? Is there a dividend coming out of the stock? Is there a meaningful borrow issue that’s happening? Is this stock hard to borrow? Are the markets super wide and we’re looking at, you know, like a stale price on one side? What’s going on here?
Are we looking at executable bids and offers, or are we doing arithmetic using two marks that, like, no one can actually trade, right? Which is obviously a problem. But what I want to drive home to people is that the calculation that we’re talking about here gives you a number, right? It gives you a forward implied price.
But the thing that actually tells you whether or not this is an actual tradable relationship that you can actually trade is the trading experience that teaches you how to investigate what’s actually going on behind the difference there.
So how much confidence should investors place in a number calculated from the options screen then?
That’s a really good question. It depends on the options screen and the options market that they’re looking at, right? A midpoint of a bid and an ask is useful for analysis, but if you can’t trade on that midpoint, it’s not really something that’s executable in the same way that it’s useful in an analytical way. And, you know, for instance, suppose the call is 480 bid at 520 with a $5 mid, and the put is 470 at 510 with a, you know, what is that? 495 mid. You can create a nice clean implied forward calculation using those two midpoints, but that doesn’t mean you can buy or sell the actual package there. And I think that’s important. When you’re thinking about how traders think, like who have been doing this for a long time, they think in executable actual prices. Where can I actually create the synthetic? And that’s something that you and I used to, you know, have that conversation in your mind all the time when you were sitting there.
Where are the actual tradable prices? The theoretical implied forward gives you a really good landmark, right? It’s useful, but executable implied forward prices that you can trade on is really what determines whether or not there’s a trade there. The gap can be pretty meaningful, especially when you’re talking about less liquid names. That’s an important part too.
And Mat, we’ve covered a lot of information. I want to kind of drill down now into some of the items that can kind of cause the forward to differ from the current stock price. So let’s start with interest rates and carry and just their effect and how they affect the forward pricing versus the actual stock price.
Yeah, that’s a great place to start particularly in an environment where you think the risk-free rate or the overall interest rate might be moving around because that’s gonna change how these things are priced. If you own stock, let’s say most generally you have a stock position, you have capital tied up in that stock position, and that capital has a cost.
In the simplest version here, the forward value of a non-dividend paying stock will generally be above the current stock price further out in time because you’re carrying the stock through that time, and time costs money. And so the implication is that the stock will generally be worth more as you go further out in time. The longer the time and the higher the interest rate, the more that carry cost generally shows up in the forward relationship.
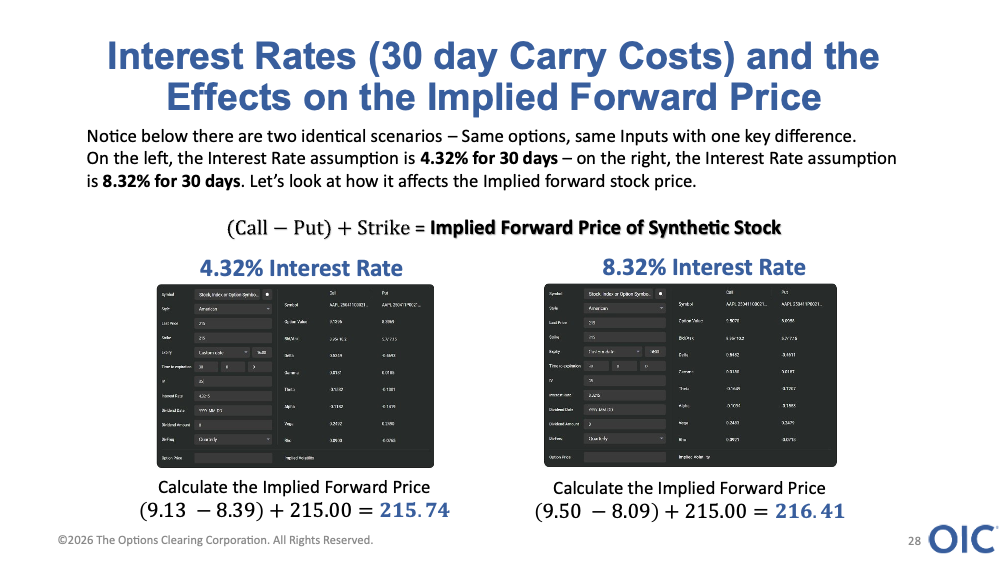
And so we have a slide that we’re gonna incorporate here that tells you a little bit about two different interest rate assumptions, one on the left and one on the right. And for those of you that aren’t looking at the actual slides themselves, what we have is basically on one side we have a four point three two interest rate assumption, and on the other side we have an eight point three two interest rate assumption.
Obviously, 400 bips is a huge difference in, you know, in a rate. But the reason why I chose these two things is ’cause I want to be able to show people how when you look at this for 30 days, if you really jack the interest rates and move them around, it can show up in the implied forward very quickly. And so this slide holds almost all of the assumptions exactly the same. The only thing that’s different is the rate. On the left side, you have a four point three two rate. On the right side, you have an eight point three two rate. And when you look at where the actual options are priced, on the left side with the four point three two rate, the implied forward is two hundred and fifteen bucks and seventy-four cents.
But when you look at the higher rate, the implied forward is two hundred and sixteen bucks and forty-one cents. So it’s a huge difference. It’s a difference of almost like 65 cents in how much that stock is implied at the end of that 30 days. The stock didn’t suddenly become a better company because the interest rate assumption changed.
This is just financing, right? This is the cost of carry. This is the cost of carrying the stock being reflected through the relationship between the call and the put. It’s another reason why we shouldn’t interpret every implied forward difference as directional sentiment. That’s not what this is.
Sometimes it’s just the cost of carry, right? That’s like part of this.
I was saying, and I’m assuming duration makes that larger, correct?
Yes, absolutely. Duration on top of the cost of carry, just like, right, everyone talks about the strongest force in the universe is compound interest. That’s really what we’re talking about here, too. Generally, yes, a small amount of annual financing difference over five days isn’t gonna compound very much.
But if you apply it over a year or two years, it becomes much more visible as those changes compound. And, Jeff, when you and I were trading options on sheets and looking at screens, right? Old traders that were conversion and reversal traders were always looking at rates. And many times I would think, like, “Why are these guys so fascinated with what rate people are using?” And it’s because the conversion and the reversal was effectively a financing trade wrapped up inside the difference between where the options were priced and where the stock was priced. And the rate wasn’t a side issue. It was the whole trade, right? Like, what is your rate assumption and what is my rate assumption were two completely different things.
And Mat, dividends work in the other direction though, correct?
Yes. Good point. Dividends work in the other direction because if you own the stock through an ex-div date, you are entitled to the dividend. I always like try to push this as an idea. The only people who really get paid the dividends are the people who own the actual stock through the ex-div. A synthetic stock position does not necessarily receive that cash payment in the same mechanical way that you would if you owned the actual stock. And so the expected dividend therefore gets reflected in the put call relationship, that put call parity triangle that we always talk about. All other things being equal, a dividend expected before the expiration of the options is going to be included in those option prices and is gonna reduce the forward price relative to the current cash stock price.

So I want you to think about it this way. If you hold that stock through the ex-div date and it’s a $2 dividend. Generally speaking, after the dividend is paid, you would walk in and if everything went according to plan, the stock would open theoretically $2 lower, but you would have the $2 that you had been paid for the dividend for being long the stock. And when you looked at the stock, even though it was trading $2 lower from yesterday’s closing price, it would say unchanged on it next to it. Because what has happened is that the cash has theoretically come out of the actual company and been paid to its shareholders. So we have an example on a screen.
Again, if you’re not looking at a screen on one side, on the left side of our screen, you have a dividend that’s actually included in the options. On the right side of the screen, you have a dividend that’s excluded in the options. This example shows how much timing of the options can matter. On one side, the $2 dividend occurs before the options expire, meaning it’s built into the option prices.
And on the other side, the $2 dividend is paid after the options expired, so it’s not built into the options pricing. The other inputs are held constant, but the implied forward changes again materially. That changes huge in a very large way, and it tells us something about why expiration selection really matters when you’re talking about dividends.
Because two option expirations on the same stock can imply very different forward relationships, because one might include a dividend and the other one might not. And so it’s important for people to look at this and say, “Okay,” and this is one of those things, again, one of those things that I always talk about is when you see something that looks like free money, I always want you to look at it and say, “Okay, like why is this the case?”
Because someone might look at this and say, “The call on this side looks relatively cheap to everything else,” and the answer may not be bearishness or that someone has messed up a calculation. The answer may be that the stock is expected to pay a dividend before those options expire, and the rest of the options don’t have it in there, and the options market is just adjusting for that amount of cash leaving the company during that period, but not in the rest of those periods.
And dividends kind of walk us perfectly into the next potential hiccup or pricing input for these. And that’s, you know, early exercise or assignment risk with American style options, right? Someone gets a dividend, whether you’re long, like you just said you’re long that call, it’s gonna drop by $2 unless you exercise it and get the stock. Or conversely, that you’re on the other side of this and you’re short the call and you could get assigned. How does, you know, early exercise risk kind of play into these?
Yeah, that’s important. Important distinction here. The only time that you can actually be assigned on options is when you are short the options. Remember that. And then if you’re short something that’s like an in-the-money call going into an ex-dividend date, the holder of that call, the person who’s long it, may have an economic incentive to exercise that call early.
The reason why is exactly what I said about dividends being paid to stockholders and not option holders. If you own that in-the-money call and you want that dividend, you have to actually exercise that call and turn it into an actual long stock position before the record date that is set for that corporate action. And so the company has to see you as a stockholder of record at that point in time. And so as far as the options are concerned, the general question is whether the dividend is worth more than the remaining benefits of continuing to hold the option. Because remember, if you’re turning that option into an actual stock position, you’re foregoing all of the actual optionality that’s left, the time part of the optionality, because once you turn it into a stock position, it’s not an option position anymore.
And particularly if it has remaining extrinsic value built into it, that can be a calculation that starts to get a little bit more nuanced, and you need to understand it. If the call has very little extrinsic value in it and the dividend is meaningful, like it’s a big dividend, the early exercise risk, if you’re short that call, can increase significantly. And so for someone holding a synthetic short stock position, which means you’re short the call and long the put or a conversion type position, that assignment can change the position overnight, right? Because if you get early assigned on your short call, you have a completely different position than you had before.
The economics still makes sense, but the position may not look the way that it looked before when you went home the day before. And so that’s why a synthetic payoff diagram is not the entire risk management story, right? These, like I said before, these are option positions. You have to treat these like they’re still option positions, even though they’re put on as a way to synthetically create stock positions.
We keep talking about how this is not stock, it’s synthetic stock and there is a huge difference. So, what happens, if anything, when the actual stock becomes hard to borrow, or if it becomes hard to borrow?
That’s a good question, and things start to get a little bit tricky then. The ability to short the physical stock is something that becomes very valuable when there’s not a lot of stock out there. The float isn’t very big for people to be able to borrow it or their brokerage firm to go find it for them so that they can sell it in the open market and have a short position, right?
That value can show up in the option relationships too. A synthetic short may trade at a completely different implied level from what a simple interest rate dividend calculation would suggest because in a situation like that, the physical stock is really either difficult or very expensive to borrow so that you can sell it. So this is one of the classic mistakes people make when they see something that looks like free money, right? They calculate an implied forward, they compare it with the stock price, and they just like automatically conclude that there’s an arb there.
And oftentimes we’ll get emails about this. People put these positions on, and then they discover that they either can’t borrow the stock or that the fees that they’re being charged to borrow the stock to complete this whole position consumes all of the edge that they thought they were getting, right? Or they can also be recalled on their short stock position.
They can be what we used to call being bought in on your short stock position, and that market may look wrong when you look at it initially because your calculation in that situation is missing a big risk input, which is this thing might be hard to borrow. And so borrow is one of those inputs that’s really easy to ignore right up until the point that it’s like the only input that matters as far as your position is concerned, and that’s something you need to really keep on the headline risk when you’re looking at things like this.
So let’s kind of take that example. You know, someone calculates a synthetic stock value, you know, that appears really far away from the physical stock. What should they check before assuming the market’s mispriced?
That’s a really good question. And this is kind of like the checklist that I want you to think about. First, check the markets, check the option prices. Are they current? Are you looking at like actual option prices in the marketplace? Are these mid-prices that you’re using for calculations, are they executable prices? Like how wide are those spreads? Is this a real thing that I could actually trade? So that’s the first thing you need to make sure you confirm. Second, confirm that the call and the put are both on the same strike and in the same month, right? That’s what’s gonna keep those things in line. Put call parity is most closely tied when you’re talking about same strike, same month. And then third, I want you to check whether a dividend falls inside the option period that you’re talking about. If it’s a 30-day option, you need to look at whether or not this company is theoretically paying a dividend in the next 30 days. Fourth, I want you to think about rates and the timing remaining in those options.
Also, when you’re thinking about rates, you also need to think about whether or not there is some meaningful potential change in rates between now and the time the options expire. Because if there’s a Fed meeting where they might significantly change rates, you need to build that into your risk matrix as well. And then make sure you determine whether or not this is a hard to borrow stock. Then include commissions, fees, margin, and the possibility of assignment, right? It seems very simple, right?
Right. Free is not free.
Exactly. But I think what people will find is a lot of what they see as potential arbitrage, like really erodes very quickly once you start to build in the complete picture of where all of these risks are coming from and, you know, not just the prices on the screen that might make it look like it’s mispriced relative to the physical stock, right?
It’s something that… But like build a big comprehensive picture before you start pressing buttons.
Yeah. And also, you know, occasionally someone made a bad market, right? Like every so often.
I’ve made bad markets. You’ve made bad markets, right?
Me never.
Yeah. But it’s something you want to make sure that you’re looking at the actual tradable situation before you put the trade on, basically.
Mat, if most individual investors aren’t trading conversions reversals, why should they care about the implied forward then?
That’s a really good question. It helps when you start to look at this in a really kind of cohesive risk way, it helps people to understand what they’re looking at in the options chain, and it can explain why calls and puts on the same strike aren’t trading necessarily at the same price or the price that you would expect them to trade. And it can explain why at-the-money strikes may not line up exactly with the current stock price. Oftentimes people will look at that, and it can help explain differences between expirations where, right, one expiration might have the dividend in it, the other one might not have the dividend in it, et cetera, et cetera.
It gives you just an overall better appreciation for how these synthetic positions line up relative to the physical stock. Instead of seeing a call, a put, and a stock price as three separate products and three separate prices, you can start to see them as different ways of packaging kind of what I would call related economic exposure, right?
Those three things all have different pieces of economic exposure, and it’s important that you keep in mind how they’re related. It’s a much more useful way to understand the options market, and it helps people avoid overreading certain situations that they might think created arbitrages where they’re not there. You know, a call trading over a put doesn’t automatically mean the market’s bullish. Like we said, right, throughout this we’ve been saying these are not forecasts. These are just economic realities of things like funding costs, carry, and potential dividends, et cetera. So you have to account for that forward relationship when you’re looking at those things relative to the physical stock price.
A lot of great information here, Mat. When the investor’s looking at options, like a real options chain, like how are they using this?
Yeah. So I recommend that people start with the stock price where it’s trading, find a call and a put with the same strike and expiration, use reasonably liquid options, and start close to where the stock is trading. Take the call price, subtract the put price, add the strike, right? That gives you a rough implied forward, then compare it with where the actual physical stock is trading and say, “Okay, if there is a difference there, what is going on here?” Don’t immediately label the difference as mispricing or like sentiment or some sort of forecast. Look at the expiration date of the options.
How much time is there in there? Is there a dividend in there? How much time is left? Are there interest rate assumptions that are different? Is the stock hard to borrow? How wide are these option markets, right? The calculation is the beginning, the very beginning of the investigation. It’s not the end point of this investigation.
And that old trader answer to a lot of market questions is the first number that you get on your spreadsheet is the only thing– it tells you is where you’re looking next. It’s not necessarily the only thing you need to look at. So make sure you build that in.
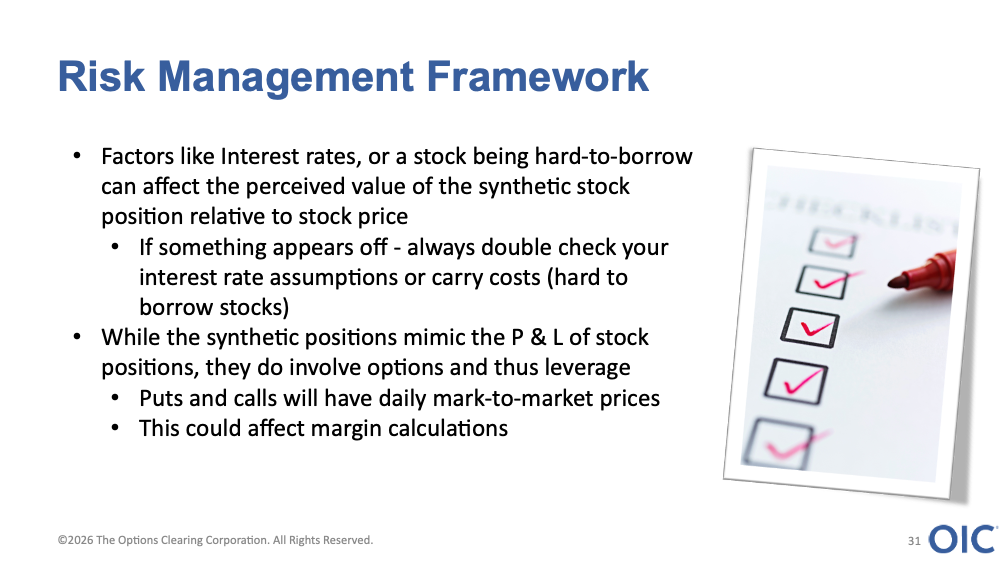
Yeah. I think the key this whole discussion is that position may mimic stock, but it’s not the stock. It’s not identical to stock, right?
Exactly. The payoff diagram that you look at when you combine the long call and the short put looks an awful lot like long actual stock. And at expiration, it’s going to look very similar to that, but the path can be completely different. A synthetic contains option positions. We’ve been talking about options this whole time, and so that means daily mark to market, it means margin, it means early assignment possibility if you’re talking about American style options, which the vast majority of these are probably going to be.
And it means understanding expiration mechanics if you’re gonna carry this through expiration. And liquidity here actually matters too, because you have two option legs rather than one stock trade when you’re talking about a synthetic stock position. The stock may be hard to borrow, the options may have wide markets. There’s all kinds of things that can be built into this, and you may be able to describe the package as synthetic stock, but you still have to manage it as an options position because that’s what it is. And this is especially important for people who hear the word synthetic and interpret it as, like, identical. Economically similar in this case does not mean operationally identical. I spent a lot of time talking about that, and it’s important that you understand that.
And Mat, this is always great when you swing by. I’d like to leave our listeners, really just with kind of the main points that they should remember. So if you could leave us with sort of some final thoughts on key points for them.
Yeah, absolutely. So the first thing I would say, going back to the very beginning of what we talked about, and we’ve covered a lot of ground here, but the first thing is calls, puts, and stock are tied together economically through put-call parity. They’re not all the same thing, but they have different parts of economic reality built into them, and you need to understand that they’re all tied together in that way.
Second, long call and short put together on the same strike and the same expiration are synthetic long stock. And you reverse those positions, short call and long put on the same strike and the same month, you’ve got synthetic short stock. Now, third, when we’re talking about long synthetic stock and short synthetic stock, the next question is always, okay, what price are those things trading? Remember the equation, which is call minus put plus the strike gives you that implied forward stock price associated with that amount of time up until the time when the options expire. And then fourth, that forward price is not always going to look exactly the same as the physical stock price. And if you think about it as a prediction of where the stock is going to trade, you’re going to end up down a very bad path.
So let’s not do that. What that reflects is the economic relationship between the stock, the options, the time remaining to expiration, the interest rate assumptions, dividends, and potentially the borrow costs that are associated with it. So build that in as well. And then finally, and somewhat most importantly, executable prices are really important, and those account for, like, what prices you’re actually going to trade this at, not just, like, the midpoint of those options, because sometimes you can’t always execute at midpoint.
It’s important that you remind yourself of that when you’re doing this. The options chain can tell you a great deal, but it doesn’t always tell you the answer directly, right? It kind of… It can obscure some of that information. It can be a really interesting place to find that information, but sometimes the most important and useful information is hidden in the relationship between those calls and those puts and where the physical stock is trading. So keep that in mind when you’re looking at these.
Mat, this is always a pleasure having you come in. For our listeners, you can find more from Mat Cashman at optionseducation.org or theocc.com or on our website, ibkr.com. Click on education. Thanks, Mat.
Thanks, Jeff. Always a pleasure.
The analysis in this material is provided for information only and is not and should not be construed as an offer to sell or the solicitation of an offer to buy any security. To the extent that this material discusses general market activity, industry or sector trends or other broad-based economic or political conditions, it should not be construed as research or investment advice. To the extent that it includes references to specific securities, commodities, currencies, or other instruments, those references do not constitute a recommendation by IBKR to buy, sell or hold such investments. This material does not and is not intended to take into account the particular financial conditions, investment objectives or requirements of individual customers. Before acting on this material, you should consider whether it is suitable for your particular circumstances and, as necessary, seek professional advice.
The views and opinions expressed herein are those of the author and do not necessarily reflect the views of Interactive Brokers, its affiliates, or its employees.
Options involve risk and are not suitable for all investors. For information on the uses and risks of options, you can obtain a copy of the Options Clearing Corporation risk disclosure document titled Characteristics and Risks of Standardized Options by going to the following link ibkr.com/occ. Multiple leg strategies, including spreads, will incur multiple transaction costs.












Join The Conversation
For specific platform feedback and suggestions, please submit it directly to our team using these instructions.
If you have an account-specific question or concern, please reach out to Client Services.
We encourage you to look through our FAQs before posting. Your question may already be covered!