
- Solve real problems with our hands-on interface
- Progress from basic puts and calls to advanced strategies
Interactive Options Course

Posted May 28, 2026 at 1:14 pm
Stocks recovered from a morning decline and leaped to fresh records on news that the US-Iran ceasefire will be extended for 60 days. The early selling pressure was triggered by overnight Middle East hostilities that countered well received corporate earnings; however, the S&P 500, Nasdaq 100 and Russell 2000 indices have since climbed to all-time highs on renewed geopolitical relief, and equities are on track for their sixth-consecutive day of advances amidst a ninth-straight week of gains. Meanwhile, the economic calendar was a net negative, which could explain why 6 of the 11 major sectors are in the red this session, as a downward revision on GDP, slowing consumer spending, decelerating capital expenditures, strong inflationary pressures and a miss on new home sales coincided with a beat on durable goods and higher-than-projected, but still contained, unemployment claims. The cyclical softness from the reports alongside a dip in crude oil prices is pulling interest rates and the greenback south as the yield curve descends in bull-flattening motion led by duration. Elsewhere, non-energy commodities are jumping, cryptocurrencies are sinking, volatility protection instruments are seeing lighter premiums on lessening hedging activity and prediction markets are catching bids.
First-quarter economic growth was downgraded from 2% to 1.6%, as weaker consumer spending and a sharper reduction in private inventory than originally reported weighed on the headline.
Consumer spending volumes slowed even further in the beginning of the second quarter, according to this morning’s April Personal Income and Outlays report. Inflation adjusted expenditures rose just 0.1% month over month (m/m), the weakest since January, while real incomes retreated 0.4% m/m, dropping the savings rate to its lowest level since June 2022, as households dug into their rainy-day funds to sustain shopping patterns. Cost pressures were elevated, although they arrived largely as expected, with the headline and core Personal Consumption Expenditures (PCE) price indices rising 0.4% and 0.2% m/m and 3.8% and 3.3% year over year (y/y), a tenth cooler than estimated on the monthlies but in-line on the annualized numbers. The figures compare to March m/m and y/y increases of 0.7%, 0.3%, 3.5% and 3.2%. Nondurables, durable goods and services saw 0.8%, 0.7% and 0.3% m/m charge lifts last month.
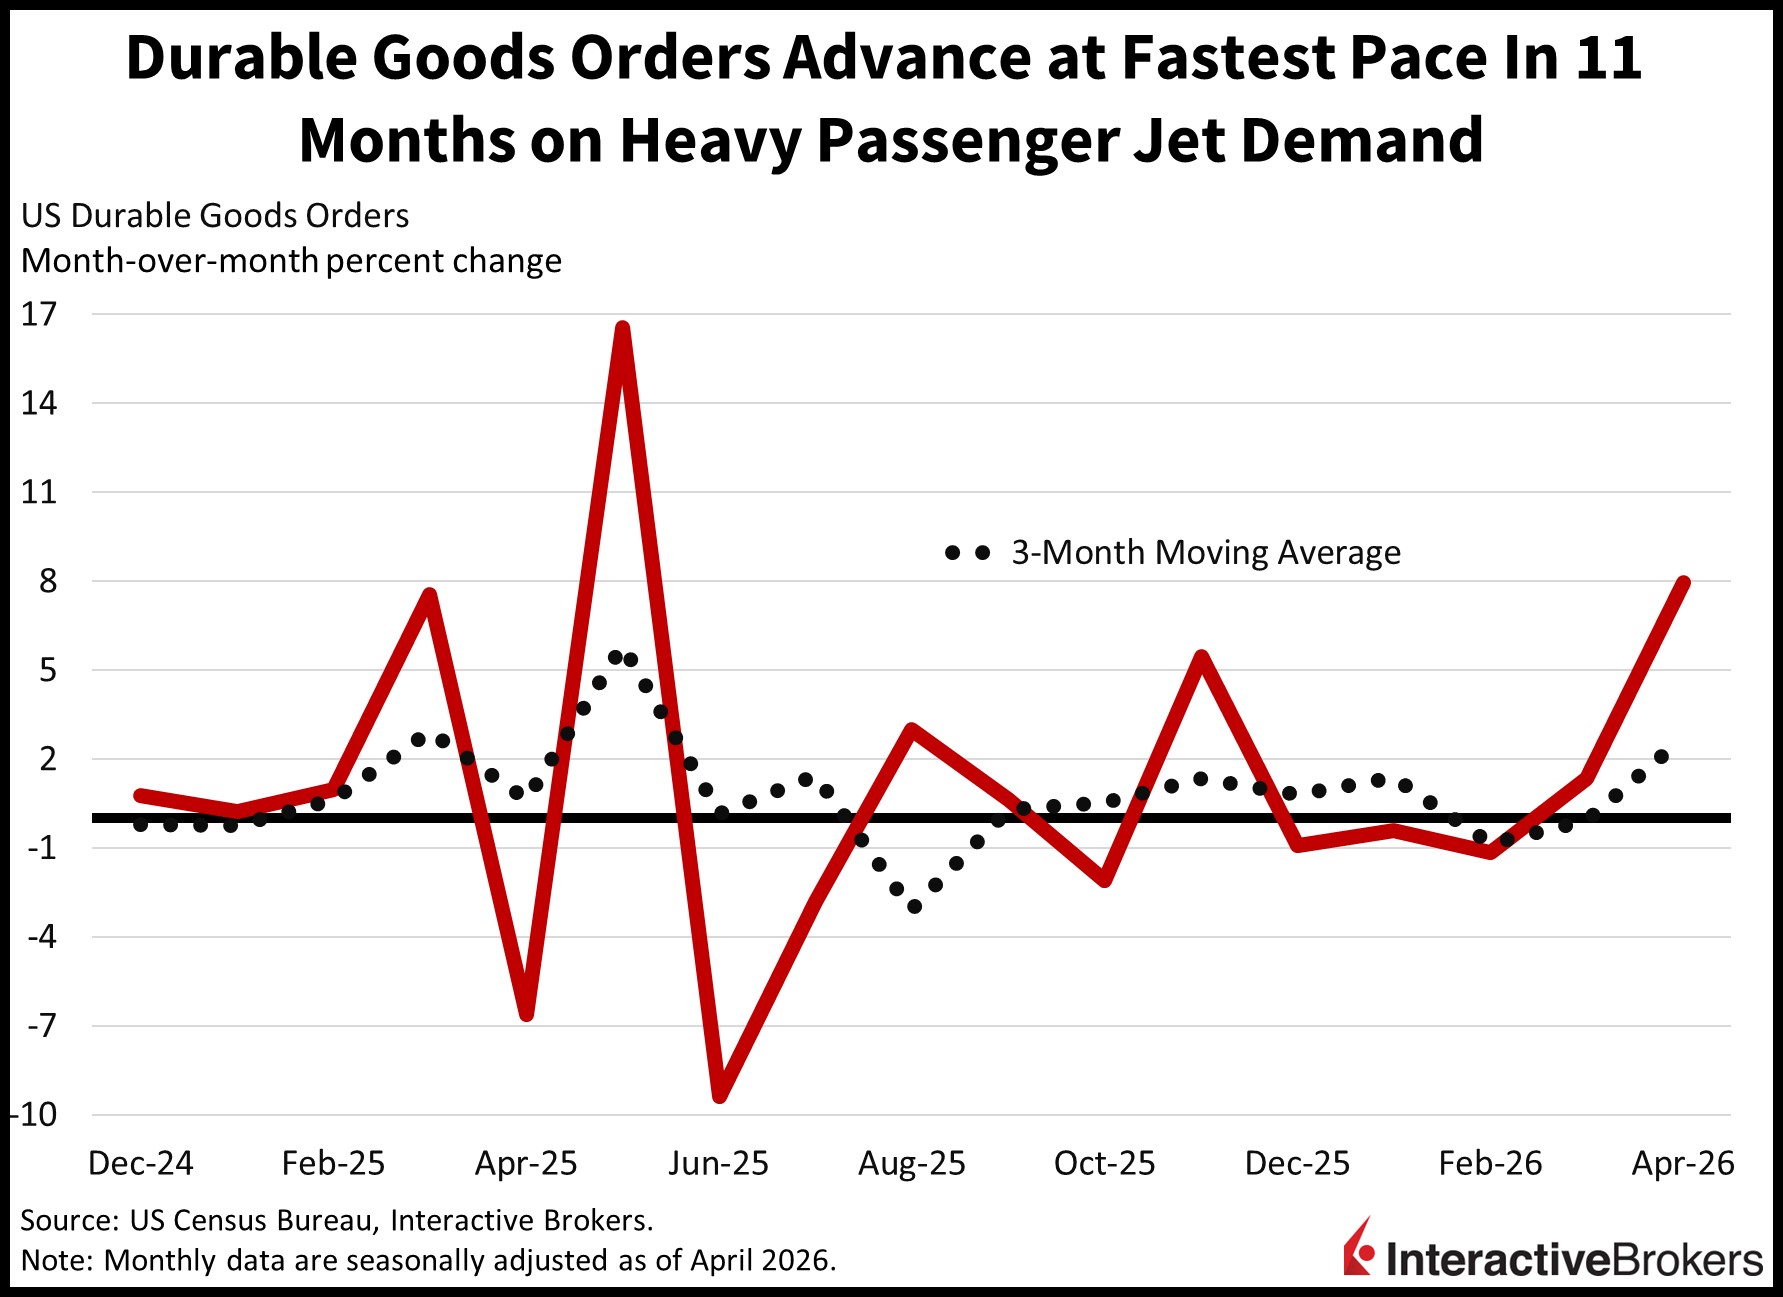
Heavy passenger aircraft purchases drove a beat in this morning’s April Durable Goods report, which depicted the fastest pace of overall orders in 11 months. The 7.9% m/m gain was much stronger than the 3.5% expected and the 1.3% for March. Almost every major category participated in the transaction progress as follows:
Conversely, business investment experienced its deepest decline in 12 months, falling 1.1%, while computers/electronic items decreased as well, but by a more modest 0.7% m/m.
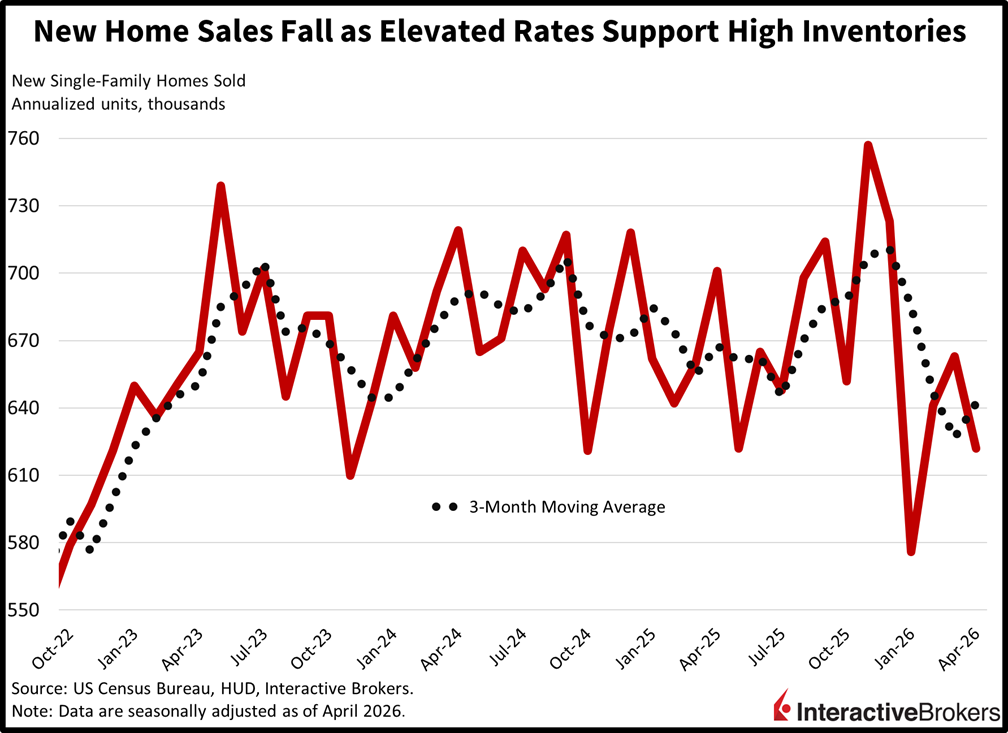
New home sales fell in April to the weakest level since January as builders struggled to manage expanding inventory amidst an elevated mortgage rate environment. The 622k seasonally adjusted annualized units marked a 6.2% m/m decline, coming in below the 670k expectation and the 663k reported in March. The West was the sole gainer from a regional perspective, seeing an 18.7% m/m lift. The Midwest, Northeast and South, meanwhile, experienced declines of 25%, 12.9% and 9.8% m/m. The average and median sale values both rose to $422.5k and $508.8k, however, even as the months of supply listing indicator, grew to a three-month high of 9.4.
Unemployment claims were well tempered in the past two weeks although the 215k and 1.786 million results across the initial and continuing segments exceeded the expected 211k and 1.780 million and the 210k and 1.771 million from the prior period. Both four-week moving averages saw modest increases to 209k and 1.773 million, but the indicators remained in the historical safe zone that is consistent with subdued layoff activity.
For almost two entire months since the low on March 30, every glimpse of geopolitical tension has been met with an alleviation that ended up being terrific for stocks. This is a characteristic of a bull market, as bad news is reacted to with modest selling pressure, while positive developments disproportionately drive noteworthy rallies. At this juncture, investors see the domestic equity space as unstoppable, with benchmark appreciation being the likely outcome irrespective of the challenges that risk assets face. Optimism is being driven by a Fed that appears increasingly poised to look through this inflation as a one-time energy shock while corporate earnings expand. Additionally, oil prices remain anchored, yields are rising in controlled fashion, consumer spending is resilient, hiring is ongoing, and capital expenditures are flourishing. Those factors virtually point to an unlimited amount of levers to pull as justifications from either policymakers or traders for equities to continue running higher.
The Bank of Korea decided this morning to hold its key interest rate at 2.5%, although two of the seven voting members stumped for a hike to curb inflation with import prices climbing due to a weak won and more costly energy commodities. The widely expected decision was followed by the central bank updating its dot plot to project a bias toward policymakers pushing the benchmark up to 3% or even 3.25% during the next six months. In April, inflation hit 2.6%, surpassing the central bank’s 2% goal.
Hong Kong’s trade deficit dropped from $89.1 billion in March to $29.5 billion last month with shipments of artificial intelligence products to the US, the European Union and other Asia markets growing. The value of goods shipped to foreign markets was up 42.9% year over year (y/y) following the 35.8% growth in March. April imports, meanwhile, were up 44.4% y/y after March’s 41.2% y/y increase. Exports to Asian markets climbed 43.7% and were led by Singapore, Thailand and Taiwan with increases of 123.3%, 84.7% and 72.7%. Looking beyond Asia, the value of shipments sent to Switzerland, the United Kingdom and the USA surged by 153.7%, 88.8% and 37.5%. Imports from the United Kingdom, India, Korea, Vietnam and the Mainland posted the most notable gains, increasing by 116.3%, 109.8%, 105.2%, 91.2% and 43.5%.
The flash Economic Sentiment Indicator (ESI) for the euro area improved marginally this month, climbing 0.3 points to 93.5 while the Employment Expectations Indicator moved northward by 2.8 points to 94.7, according to the European Commission. Both gauges, however, remained substantially below the long-term average of 100, although the former benchmark surpassed the economist consensus estimate of 92.8. In a similar manner the European Union sentiment metric climbed 0.3 points to 93.7. It was supported by confidence among consumers and the services industry ascending by 1.7 and 0.8 points. Consumers in May grew slightly less pessimistic about future financial situations, intentions to make major purchases over the next 12 months and outlooks for the economy. In the services industry, managers’ views of past business situations and future demand strengthened, but opinions of past demand slipped. The impact of gains in consumer and industry sentiment were almost entirely offset by confidence in industry, retail trade and construction sinking by 0.5, 1 and 1.2 points with the following noteworthy changes:
New to Interactive Brokers?
Open AccountInformation posted on IBKR Campus that is provided by third-parties does NOT constitute a recommendation that you should contract for the services of that third party. Third-party participants who contribute to IBKR Campus are independent of Interactive Brokers and Interactive Brokers does not make any representations or warranties concerning the services offered, their past or future performance, or the accuracy of the information provided by the third party. Past performance is no guarantee of future results.
This material is from IBKR Macroeconomics, an affiliate of Interactive Brokers LLC, and is being posted with its permission. The views expressed in this material are solely those of the author and/or IBKR Macroeconomics and Interactive Brokers is not endorsing or recommending any investment or trading discussed in the material. This material is not and should not be construed as an offer to buy or sell any security. It should not be construed as research or investment advice or a recommendation to buy, sell or hold any security or commodity. This material does not and is not intended to take into account the particular financial conditions, investment objectives or requirements of individual customers. Before acting on this material, you should consider whether it is suitable for your particular circumstances and, as necessary, seek professional advice.
Futures, event contracts, and forecast contracts are not suitable for all investors. Before trading these products, please read the CFTC Risk Disclosure. For a copy, visit our Warnings and Disclosures Page.
Trading in digital assets, including cryptocurrencies, is especially risky and is only for individuals with a high risk tolerance and the financial ability to sustain losses. Eligibility to trade in digital asset products may vary based on jurisdiction.
For specific platform feedback and suggestions, please submit it directly to our team using these instructions.
If you have an account-specific question or concern, please reach out to Client Services.
We encourage you to look through our FAQs before posting. Your question may already be covered!
Related Articles

















From an options order flow perspective, the rally in both SPX and NDX has legs to 800 in both indexes by September’s quarterly OPEX. I think something meaningful will have to change for markets to correct.