
- Solve real problems with our hands-on interface
- Progress from basic puts and calls to advanced strategies
Interactive Options Course
Posted October 22, 2025 at 11:00 am
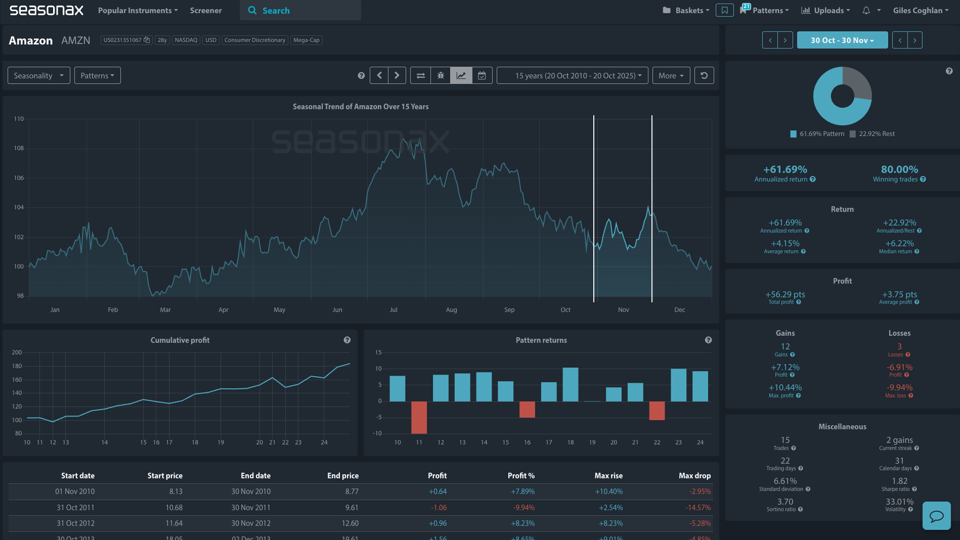
Amazon is about to enters one of its strongest trading windows just as it faces renewed questions about AWS dominance, competitive pressures, and service reliability. Amazon will announce its earnings on October 30th just as this strong seasonal pattern starts. From 30 October to 30 November, Amazon shares have posted an average gain of +4.15% over the past 15 years, with an impressive 80% win rate and a 61.69% annualized return.
Let’s analyze the seasonal data in more detail.
The detrended seasonal chart below shows a consistent pattern of strength into mid-Q4, likely driven by post-earnings momentum, holiday optimism, and institutional repositioning. Out of the last 15 years, Amazon delivered gains in 12 of them, with a standout return of +10.44% during its best year in 2018.
This year’s window is particularly interesting, as it intersects with a complex macro and company-specific backdrop:
Earlier this month, on October 20, you may be aware that AWS suffered its worst outage since 202. It lasted nearly 15 hours and impacted services from Apple and McDonald’s to Zoom, Snowflake, and even Amazon’s own Alexa and Ring systems. Though the company identified the issue and restored operations, the incident has revived fears about cloud centralization and the fragility of even the most trusted hyperscalers.
Once seen as the undisputed cloud leader, AWS is now navigating a more crowded and competitive landscape:
While AWS still commands the largest market share, Bloomberg Intelligence estimates it could shrink from 35% in 2022 to below 20% by 2030, with Microsoft expected to overtake it and Oracle potentially leapfrogging Alphabet.
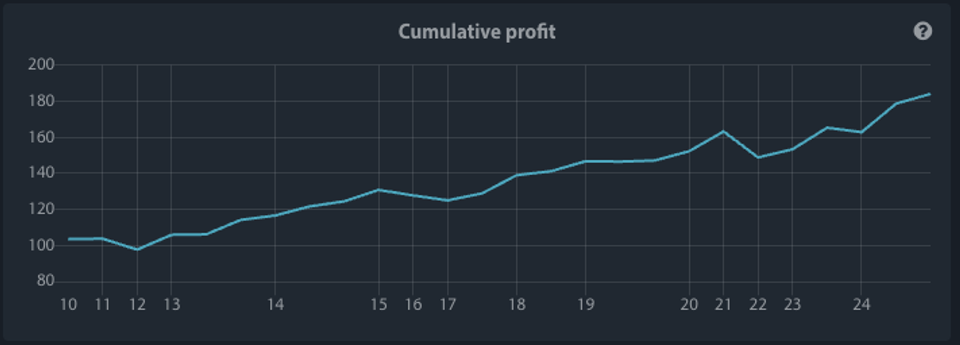
That said, according to Goldman Sachs Research, the overall cloud market is expected to exceed $2 trillion by the year 2030. So, while Amazon may lose market share, its slice of the pie could still expand in dollar terms. Furthermore, Seasonax’s cumulative profit curve for this time period points to a historically resilient reaction to Q3 earnings. The cumulative return curve shows the total result of buying Amazon in this window each year over its 15-year history. The picture is clearly a drift higher.
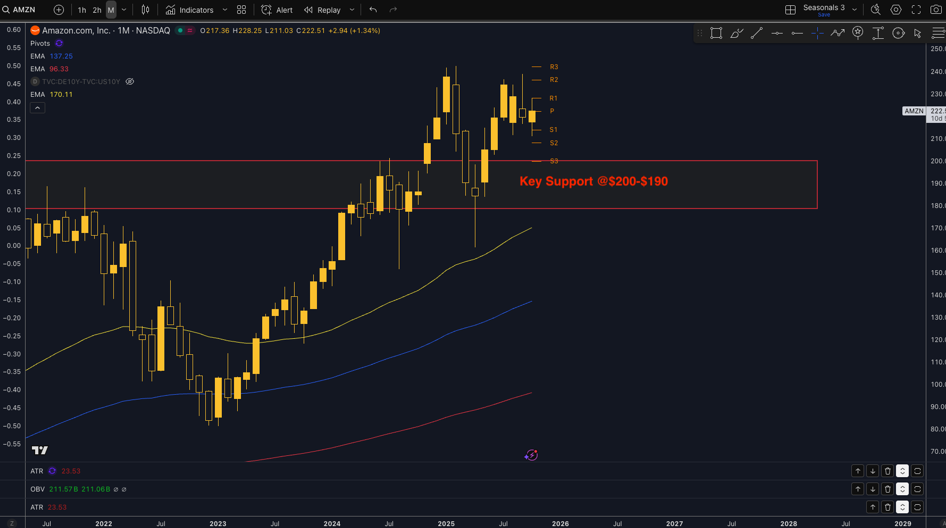
From a technical perspective, Amazon is in an uptrend and trading significantly above its 50 (yellow line), 100 (blue line,) and 200‑day (red line) EMAs. Major support is marked at $200 on the chart below and that sits around 10% below price. Remember that Seasonax data shows that the largest drop during this seasonal period was -9.94% in 2011. Also note that the maximum drawdown was -15.91% in 2022, so a sharp fall into $200 post earnings may offer a great dip buying opportunity on a slightly softer earnings outlook.
Amazon’s seasonal pattern from late October into late November is strong, but this year, AWS’s reputation, competitive positioning, and investor sentiment around cloud valuations will matter more than ever.
Should earnings reassure (or at least not disappoint too much) and holiday trends hold up, the stock could benefit from a classic seasonal tailwind. A dip lower on disappointing earnings into the $200 region could offer traders a great way of positioning smartly for this seasonal pattern. Traders may want to wait for the earnings reaction before entering to avoid the event risk, but still take note of this seasonal pattern for potential post earning buying opportunities.
Use Seasonax for your professional handling of market-moving events to find stocks poised to move!
—
Originally Posted on October 22, 2025 – Amazon’s Earnings Ahead: Seasonal Strength vs Cloud Fears!
Past results and past seasonal patterns are no indication of future performance, in particular, future market trends. Seasonax GmbH neither recommends nor approves of any particular financial instrument, group of securities, segment of industry, analysis interval or any particular idea, approach, strategy or attitude nor provides consulting nor brokerage nor asset management services. Seasonax GmbH hereby excludes any explicit or implied trading recommendation, in particular, any promise, implication or guarantee that profits are earned and losses excluded, provided, however, that in case of doubt, these terms shall be interpreted in abroad sense. Any information provided by Seasonax GmbH or on this website or any other kind of data media shall not be construed as any kind of guarantee, warranty or representation, in particular as set forth in a prospectus. Any user is solely responsible for the results or the trading strategy that is created, developed or applied. Indicators, trading strategies and functions provided by seasonax GmbH or on this website or any other kind of data media may contain logical or other errors leading to unexpected results, faulty trading signals and/or substantial losses. Seasonax GmbH neither warrants nor guarantees the accuracy, completeness, quality, adequacy or content of the information provided by it or on this website or any other kind of data media. Any user is obligated to comply with any applicable capital market rules of the applicable jurisdiction. All published content and images on this website or any other kind of data media are protected by copyright. Any duplication, processing, distribution or any form of utilisation beyond the scope of copyright law shall require the prior written consent of the author or authors in question. Futures and forex trading contains substantial risk and is not for every investor. An investor could potentially lose all or more than the initial investment. Risk capital is money that can be lost without jeopardizing ones’ financial security or lifestyle. Only risk capital should be used for trading and only those with sufficient risk capital should consider trading. Past performance is not necessarily indicative of future results. Testimonials appearing on this website may not be representative of other clients or customers and is not a guarantee of future performance or success.
Information posted on IBKR Campus that is provided by third-parties does NOT constitute a recommendation that you should contract for the services of that third party. Third-party participants who contribute to IBKR Campus are independent of Interactive Brokers and Interactive Brokers does not make any representations or warranties concerning the services offered, their past or future performance, or the accuracy of the information provided by the third party. Past performance is no guarantee of future results.
This material is from Seasonax and is being posted with its permission. The views expressed in this material are solely those of the author and/or Seasonax and Interactive Brokers is not endorsing or recommending any investment or trading discussed in the material. This material is not and should not be construed as an offer to buy or sell any security. It should not be construed as research or investment advice or a recommendation to buy, sell or hold any security or commodity. This material does not and is not intended to take into account the particular financial conditions, investment objectives or requirements of individual customers. Before acting on this material, you should consider whether it is suitable for your particular circumstances and, as necessary, seek professional advice.
Related Articles


Join The Conversation
For specific platform feedback and suggestions, please submit it directly to our team using these instructions.
If you have an account-specific question or concern, please reach out to Client Services.
We encourage you to look through our FAQs before posting. Your question may already be covered!