
- Solve real problems with our hands-on interface
- Progress from basic puts and calls to advanced strategies
Interactive Options Course

Posted April 29, 2026 at 12:45 pm
It is hard to imagine an afternoon that combines more potentially market-moving events within the span of just over two hours. We learn the outcome of an FOMC meeting at 2PM ET, witness Jerome Powell’s likely final press conference as Fed Chair a half-hour later, then after 4PM we get quarterly earnings reports from four “Mag7” stocks: Alphabet (GOOGL, GOOG), Amazon (AMZN), Meta Platforms (META), and Microsoft (MSFT). In theory, this can lead to a volatile afternoon. The reality might differ.
It is difficult to expect many fireworks emanating from the FOMC meeting. Market expectations for a rate move are essentially nil — the IBKR ForecastTrader contract for “Will the Fed leave the rate unchanged in April 2026?” is 99% “Yes”. There is always the possibility that some of the Chair’s comments at the post-meeting press conference can move markets, but even that prospect seems remote today. This morning we learned that the Senate Banking Committee approved Kevin Warsh’s nomination to lead the Federal Reserve, so it is all but inevitable that today’s meeting will be Powell’s last as Chair. Today’s presser is likely to sound more like a valedictory address than a set of comments about future monetary intentions.
The drama is more likely to involve questions about whether he stays on the Board of Governors until that term expires in January 2028. Considering that the Attorney General left open the possibility of reopening a case against him, it seems likely that he will be the first former Chair to remain on the Board since Mariner Eccles (whose name is on the building in question) did so in 1948.
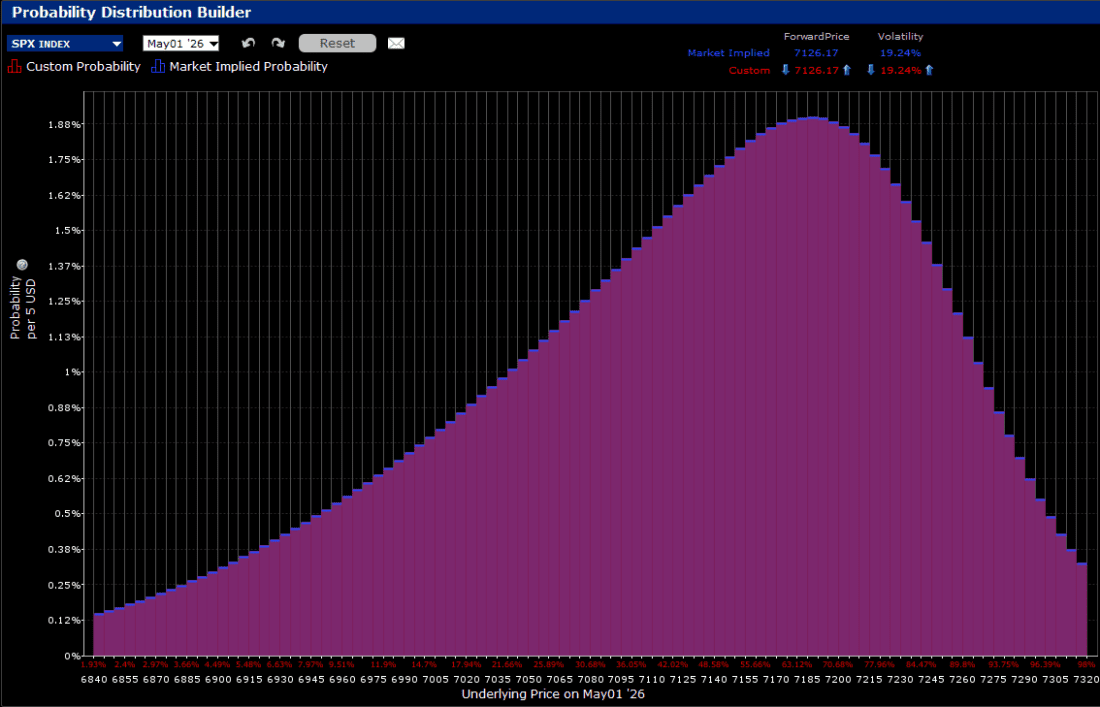
Options on the S&P 500 (SPX) imply that traders are relatively unconcerned about the prospects for fireworks during the rest of the week (in addition to the four key stocks mentioned above, Apple (AAPL) reports after tomorrow’s close). For options expiring on Friday, the IBKR Probability Lab shows a peak probability for a move to the 7200 level, about 1% above the current level. Perhaps the logic is that if the index has so far been able to ignore another leg up in oil futures and yields – SPX is only down slightly despite WTI (CL) and Brent (COIL) futures both up another 5% today and a 5 basis point bump in 10-year yields– then imagine how well the index can do if those take a breather.
IBKR Probability Lab for SPX Options Expiring May 1st, 2026
Source: Interactive Brokers
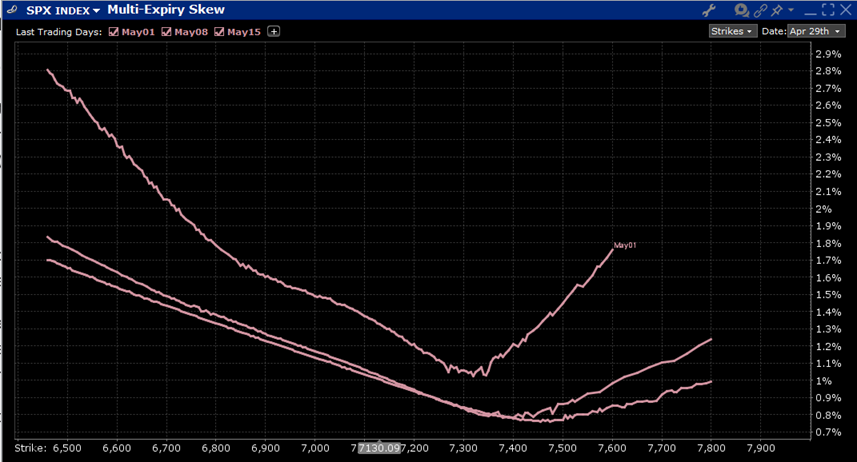
At-money volatility is relatively elevated at 1%, but that seems to indicate reasonable caution rather than concern. Near-term skew is relatively steep on this week’s options, both to the downside AND the upside, though the curves look relatively normal in upcoming weeks. In theory, if just under 20% of the index’s market capitalization moves substantially in one direction or another, that can lead to a highly outsized index move. In practice, we often see moves of this nature roughly balance each other out. That was the case in January, when double-digit up and down moves in META and MSFT, respectively, roughly canceled each other out.
Skews for SPX Options Expiring May 1st (top), May 8th (middle), May 15th (bottom)
Source: Interactive Brokers
As we look at the individual stocks that are due to report today, generally speaking, there is a bit more risk aversion, but also a relative lack of outright concern.
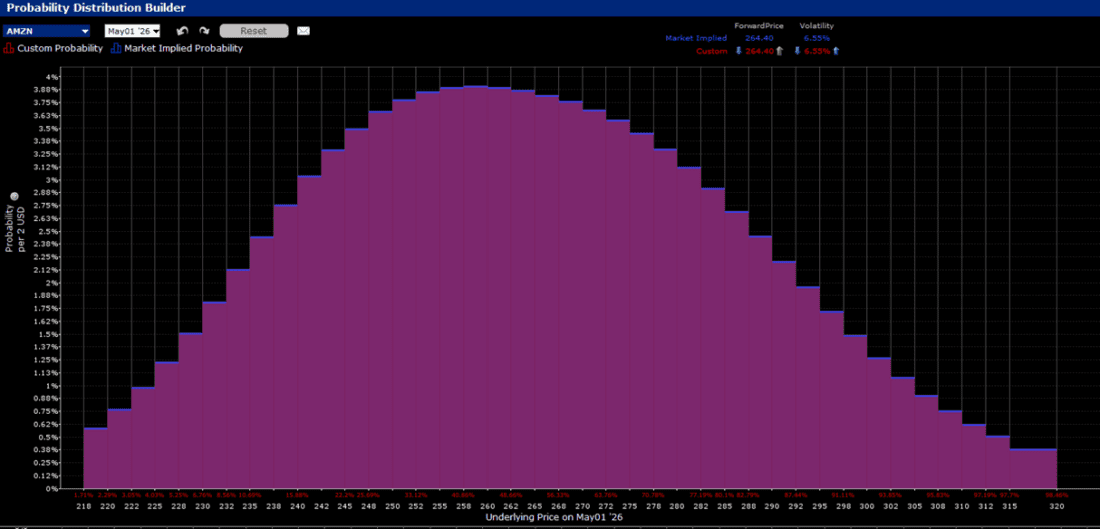
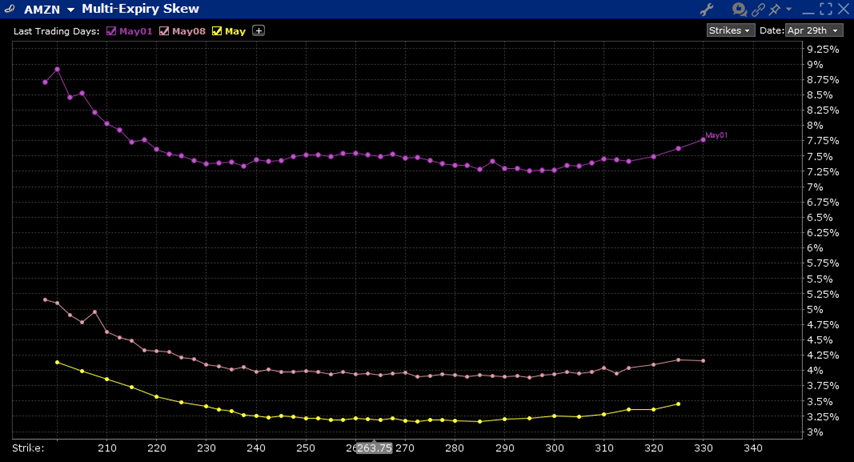
AMZN shows a peak probability in the $258-$260 region, about 2% below the current stock price. Skews are remarkably flat roughly 20% above and below the current stock price, which shows no particular bias or exceptional risk perceptions. The 7.5% at-money implied volatility for options expiring Friday is a bit above the 5.62% average of AMZN’s last six post-earnings moves (-5.55%, +9.58%, -8.27%, -0.12%, -4.05%, +6.19%).
IBKR Probability Lab for AMZN Options Expiring May 1st, 2026
Source: Interactive Brokers
Skews for AMZN Options Expiring May 1st (purple), May 8th (peach), May 15th (yellow)
Source: Interactive Brokers
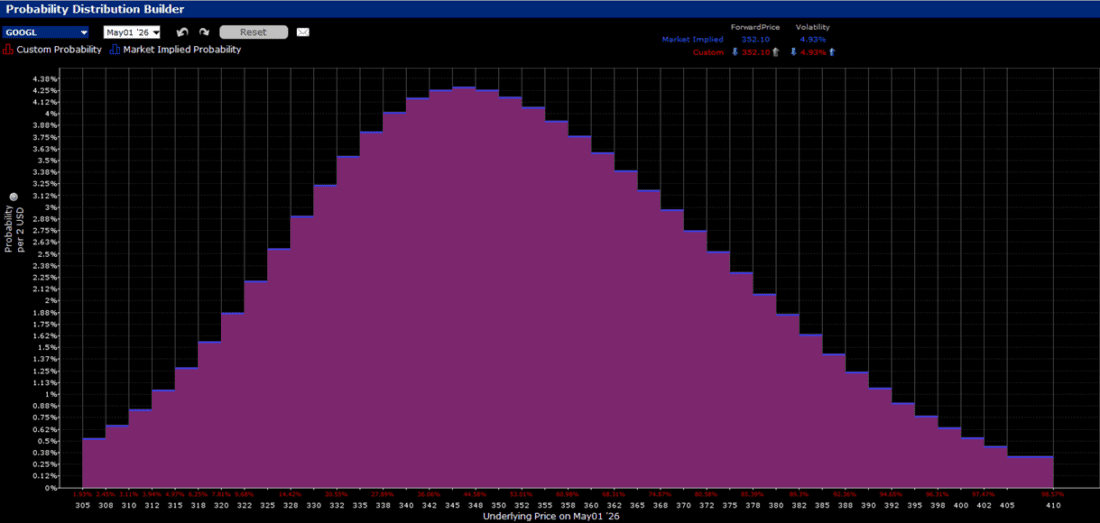
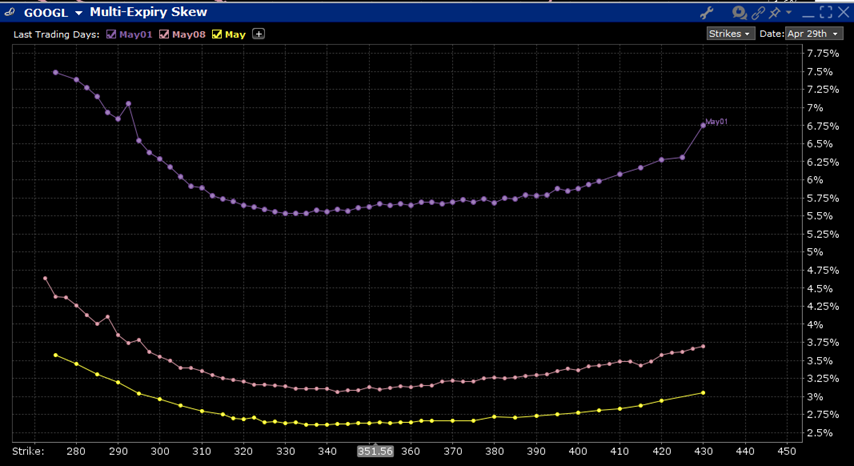
GOOGL options show a similar setup. The peak probability is in the $345-$348 range, about 1.5% below the current price, and skews are flattish, though with a slight upward bias, for a wide range around the current price. A key difference is that the at-money daily volatility for this week’s options is a relatively elevated 5.6% compared to the six-quarter average of 2.65% (-0.54%, +2.52%, +1.02%, +1.68%, -7.29%, +2.82%).
IBKR Probability Lab for GOOGL Options Expiring May 1st, 2026
Source: Interactive Brokers
Skews for GOOGL Options Expiring May 1st (purple), May 8th (peach), May 15th (yellow)
Source: Interactive Brokers
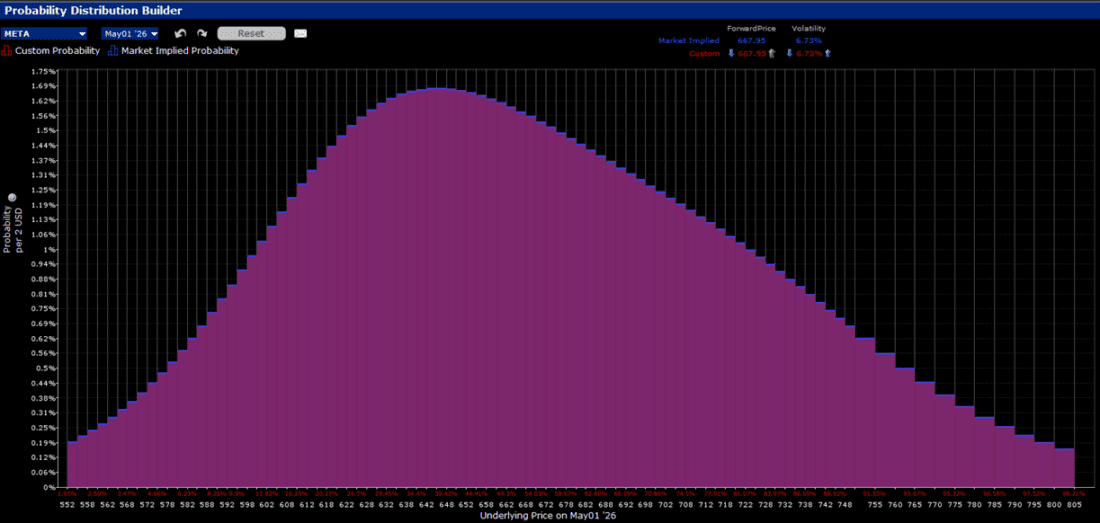
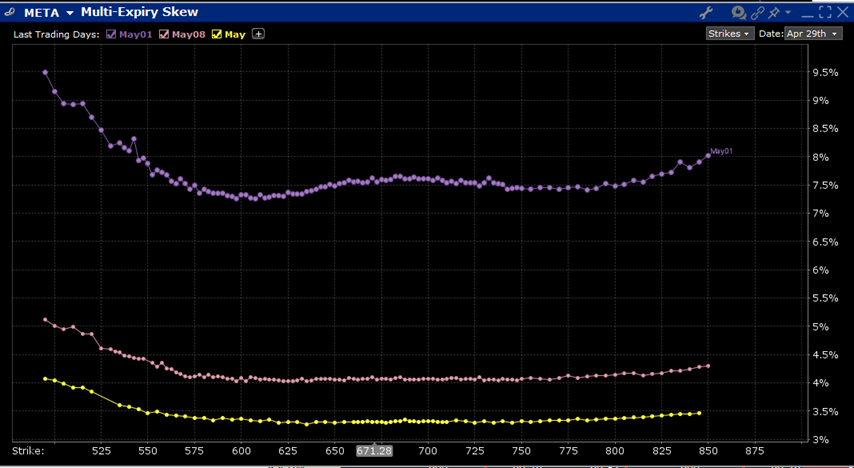
The Probability Lab shows more risk aversion in META options. The peak probability is in the $642-$645 range, about 4% below the current stock price. Nonetheless, skews are relatively flat for this stock as well, and the 7.5% at-money volatility is commensurate with the average of META’s last six post-earnings moves, but well below its moves after the last three quarterly reports (+10.4%, -11.33%, +11.25%, +4.23%, +1.55%, -4.09%).
IBKR Probability Lab for META Options Expiring May 1st, 2026
Source: Interactive Brokers
Skews for META Options Expiring May 1st (purple), May 8th (peach), May 15th (yellow)
Source: Interactive Brokers
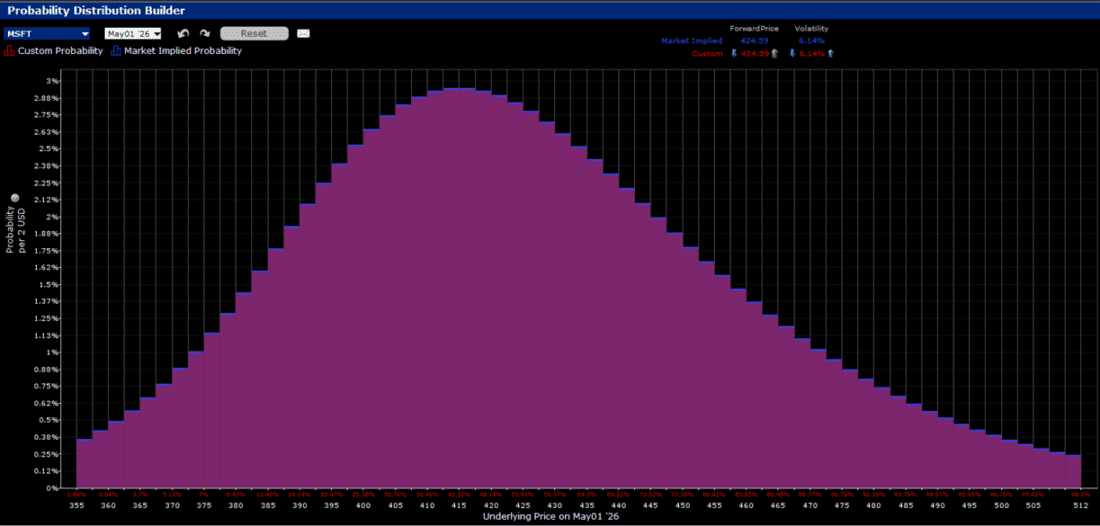
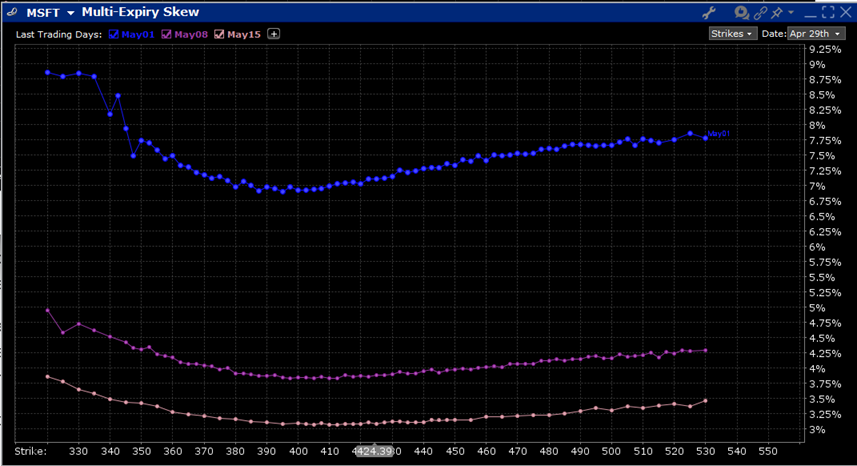
When it comes to MSFT, once again we see a peak probability below the current stock price, this time around the $415 strike, which is about 2% below that stock’s current price. However, the generally flattish skew shows a dip in below-market options and a boost to above-market strikes, indicating hopes that the recent bounce could continue after today’s report. The at-money daily volatility of 7% implies a post-earnings move that is a bit above the six-quarter average of 6.12%, but traders certainly remember last quarter’s outsized decline (-9.99%, -2.92%, +3.95%, +7.63+, -6.18%, -6.05%).
IBKR Probability Lab for MSFT Options Expiring May 1st, 2026
Source: Interactive Brokers
Skews for MSFT Options Expiring May 1st (blue), May 8th (purple), May 15th (peach)
Source: Interactive Brokers
There is one key sector that also bears watching this afternoon: semiconductors. Once again, we have a semiconductor stock with a big rally after beating consensus EPS and raising guidance. The 12% jump in Seagate (STX) is leading to gains in other storage chip makers and allowing the Philadelphia Semiconductor Index (SOX) to break its two-day losing streak. But SOX’s recent 18-day winning streak and 40% jump loom large over this afternoon’s earnings. If these AI hyperscalers commit to maintaining or raising their spending plans, then SOX should respond positively. If these companies appear to be wavering in their plans to spend billions on artificial intelligence hardware, then the stunning recent rally in semis and other related stocks could be on shaky ground. Stay tuned this afternoon!
New to Interactive Brokers?
Open AccountAlready an Interactive Brokers Client?
Request Trading PermissionThe analysis in this material is provided for information only and is not and should not be construed as an offer to sell or the solicitation of an offer to buy any security. To the extent that this material discusses general market activity, industry or sector trends or other broad-based economic or political conditions, it should not be construed as research or investment advice. To the extent that it includes references to specific securities, commodities, currencies, or other instruments, those references do not constitute a recommendation by IBKR to buy, sell or hold such investments. This material does not and is not intended to take into account the particular financial conditions, investment objectives or requirements of individual customers. Before acting on this material, you should consider whether it is suitable for your particular circumstances and, as necessary, seek professional advice.
The views and opinions expressed herein are those of the author and do not necessarily reflect the views of Interactive Brokers, its affiliates, or its employees.
Options involve risk and are not suitable for all investors. For information on the uses and risks of options, you can obtain a copy of the Options Clearing Corporation risk disclosure document titled Characteristics and Risks of Standardized Options by going to the following link ibkr.com/occ. Multiple leg strategies, including spreads, will incur multiple transaction costs.
The projections or other information generated by the Probability Lab tool regarding the likelihood of various investment outcomes are hypothetical in nature, do not reflect actual investment results and are not guarantees of future results. Please note that results may vary with use of the tool over time.
For specific platform feedback and suggestions, please submit it directly to our team using these instructions.
If you have an account-specific question or concern, please reach out to Client Services.
We encourage you to look through our FAQs before posting. Your question may already be covered!
Related Articles














Intel was up another 10% today on nothing. It has now gained $140 billion in market cap in 4 days on NOTHING. This is the BIGGEST TECH BUBBLE EVER. Here is yet another warning sign: When the Nasdaq peaked in March of 2000 the price of the QQQ (Nasdaq 100) was 78% of the price of the SPY (S&P 500.) The price of the QQQ is now almost 93% of the SPY. This market is officially in the Twilight Zone.
Nvidia was a non participant today, and remains down even in the overnight session when everything gets jacked up. Intel, AMD, Micron, and the usual suspects. The S&P 500 closed today with a market cap of $65.033 TRILLION(!!!) of which the top eight tech stocks have a combined market cap of almost $25 Trillion, more than 38% of the entire index. $25 trillion is also more than $3000 for every person on the planet. I am waiting to buy at much lower prices. If the S&P goes to 7500 or 7700 or 8000 or whatever, then it will just crash from a higher level. The QQQ will get obliterated. I will wait! It is EXACTLY like the internet bubble.
Recovering your lost investment funds as the case might be, is not what you can do alone, you’d require the service of a trained recovery specialist. A recovery specialist is a person or a group of people who are well equipped to work around the brokerage network. They have vast knowledge about the whole network and have the right software and private keys to follow any transaction. I was ripped off 147k trading online to an investment broker, good thing I got every penny back through the help of Gavin ray he’s a genius Contact : Gavinray78 at g ma il com or whatsapp +1352 322 2096 It is also important to be patient and really calm during the process.