
- Solve real problems with our hands-on interface
- Progress from basic puts and calls to advanced strategies
Interactive Options Course

Posted June 17, 2025 at 1:12 pm
A trio of weaker-than-expected economic data prints alongside an escalation in Middle East tensions are weighing on investor psyche today. The sharpest fall in retail sales in over two years coincided with the worst homebuilder sentiment reading in two and a half years. Industrial production, meanwhile, also missed estimates badly, as the utility segment offset modest progress in manufacturing and mining. Turning to the geopolitical front, President Trump left the G7 summit in Alberta early to focus on the Tel Aviv and Tehran conflict and the Commander in Chief is looking for a longer-term solution to the strain, not just a ceasefire. The mix of downbeat economic data amidst an increasingly complicated foreign affairs situation has market participants adopting somewhat of a risk-off posture. Traders are reducing stock exposures in all sectors ex energy and selling bitcoins while they increase their holdings of greenback futures, volatility protection instruments, forecast contracts and major commodities minus lumber. Additionally, folks are picking up Treasuries within the fixed-income complex, and the yield curve is drifting south in bull flattening motion, led lower by the long-end as decelerating economic data dial up slowdown fears.
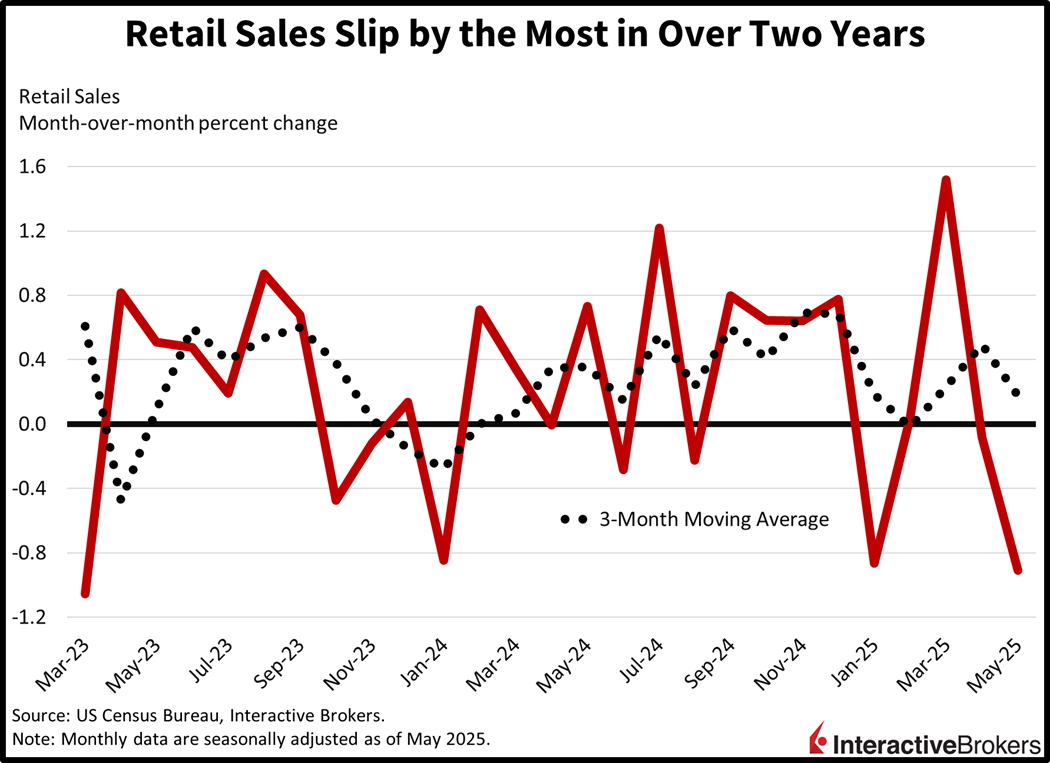
Retail sales plunged by the most since March 2023 last month as consumers took a break from frontloading purchases in earlier months in efforts to avoid April Trump tariffs. May transactions fell a whopping 0.9% month over month (m/m), beneath the median estimate of -0.7% and the prior month’s downwardly revised -0.1%. Seven of the thirteen major categories registered declining m/m revenues with the overall result hurt by automobile dealerships, building materials suppliers, gasoline stations, restaurants/bars, food markets, electronics and appliance destinations and health/personal care stores, which dropped 3.5%, 2.7%, 2%, 0.9%, 0.7%, 0.6% and 0.1% m/m. Offsetting the weakness were miscellaneous retailers, sporting goods shops, furniture showrooms, ecommerce, clothing establishments and general merchandise sellers, which grew receipts 2.9%, 1.3%, 1.2%, 0.9%, 0.8% and 0.1% m/m. Finally, the control group, which contributes heavily to the government’s consumption calculation related to gross domestic product (GDP) and was helped by the gains in the latter segments, rose 0.4% during the period, better than the 0.3% projected and the 0.1% decline from the previous interval.
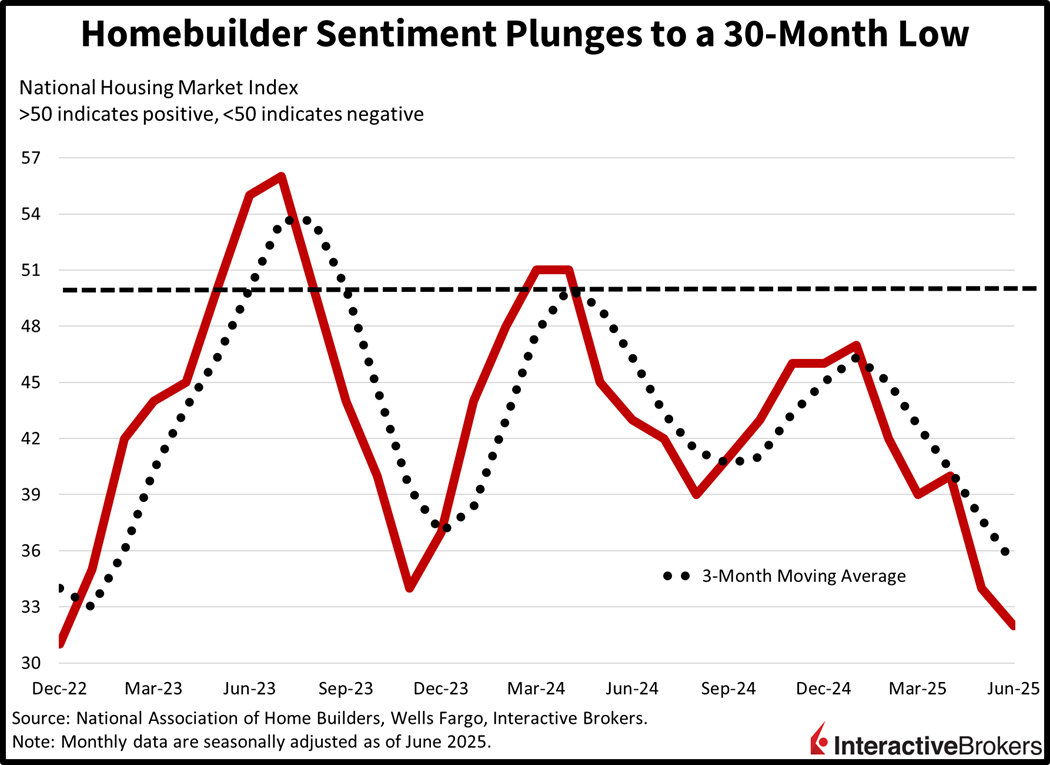
Homebuilder sentiment tanked to its worst level since December 2022 this month as elevated mortgage rates, pricey materials and costly properties weigh on the outlook for construction. The headline figure from the National Association of Home Builders and Wells Fargo came in at 32 for June, below the median estimate of 36 and May’s 34. All three major components contributed to the decline, with sales momentum in the present, prospects for transactions six months out and the traffic of prospective buyers dipping from 37, 42 and 23 to 35, 40 and 21. From a regional perspective, the Midwest, South and West slipped from 40, 32 and 27, to 39, 30 and 22. The Northeast was an exception to the broad-based weakness, however, climbing from 42 to 44.
Industrial production slipped last month as a sharp decline in the utilities category countered the marginal gains in manufacturing and mining. The May headline contraction of 0.2% m/m was worse than the 0.1% increase expected, which would have matched April’s result. Utilities output weakened a sharp 2.9% m/m, while manufacturing and mining grew 0.1% each. Among major market groups, business equipment expanded 0.8% m/m while construction, materials and consumer goods slipped 0.7%, 0.2% and 0.2%.
Today’s release of import/export price indices from the Bureau of Labor Statistics provided further evidence of subdued inflation last month. Indeed, May charges for imports were unchanged m/m while costs for exports dipped 0.9%. In imports, a 4% m/m decline in the fuel category offset the 0.3% hike in all other areas. For exports, meanwhile, a 0.2% climb in agricultural stickers was countered by a 1% drop in the other segments. From an annualized perspective, import prices were up 0.2% year over year (y/y) while exports were higher by 1.7% y/y.
Today’s weaker data is par of the course considering that the landscape has been plagued with uncertainty and hesitation. At tomorrow’s Fed decision we will be reminded of the difficulty in forecasting economic prospects amidst limited visibility characterized by unknowns related to geopolitics, trade, immigration and the fiscal path forward. Still, investors have been buying the dip today and despite the negative headlines of the past few days, the S&P 500 remains above its pivotal tug of war level of 6,000. But for the bullishness to remain supported, we can’t afford a spike in oil prices driven by an escalation in the Middle East conflict, a surge in unemployment claims motivated by downbeat consumer spending, or a climb in long-term interest rates caused by excessive deficit expenditures.
The Bank of Japan (BoJ) decided to leave its key interest rate unchanged at 0.5%, which it established with a hike in January. Additionally, it announced it will ease the pace of tapering of its monthly bond purchases. Instead of reducing bond purchases by 400 billion yen per month, it will trim its acquisitions by 200 billion yen, starting in April of next year, to avoid debt yield volatility that could harm the economy, according to BoJ Governor Kazuo Ueda. The outlook for future rate hikes as part of the BoJ’s efforts to normalize its monetary policy has become increasingly unclear as the country has yet to finalize a trade deal with the US.
South Korea import and export prices declined 3.7% and 3.4% m/m, respectively, last month. In April, prices for the two categories sank 2.3% and 1.5%. Charges for both categories were also lower than in the year-ago period, recording declines of 5% and 2.4%, just one month after results of a 2.6% drop and a 0.4% increase. In May, the m/m drop for imports was led by raw materials, which dipped 5.5%, followed by 3.2%, 2.7% and 2.3% declines for intermediate goods, capital goods, and consumers goods. Among exports, manufacturing product stickers shrank 3.4% and agricultural, forestry and marine products weakened by 0.8%.
Hong Kong’s unemployment rate hit 3.5% during the three-month period ended in May, up by 0.1 percentage points from the February through April period, according to the Census and Statistics Department. The underemployment rate also climbed, moving from 1.3% to 1.4%. During the recent reporting period, the total number of working individuals fell by 12,400 to 3,664,700 and the labor force contracted by approximately 6,000 to 3,800,500. The construction and transportation sectors experienced the largest increases in unemployment.
Singapore’s trade balance fell from 14.22 billion SGD in April to 7.24 billion SGD in May, with non-oil exports sinking 12% m/m and 3.5% y/y compared to gains of 10.4% and 12.4% in April, according to Enterprise Singapore. For the y/y tally, economists expected an 8% increase. In May, exports of electronics rose 1.7% y/y while other items, in total, shrank by 5.3%. Shipments to the US moved south by 20.6% y/y.
Information posted on IBKR Campus that is provided by third-parties does NOT constitute a recommendation that you should contract for the services of that third party. Third-party participants who contribute to IBKR Campus are independent of Interactive Brokers and Interactive Brokers does not make any representations or warranties concerning the services offered, their past or future performance, or the accuracy of the information provided by the third party. Past performance is no guarantee of future results.
This material is from IBKR Macroeconomics, an affiliate of Interactive Brokers LLC, and is being posted with its permission. The views expressed in this material are solely those of the author and/or IBKR Macroeconomics and Interactive Brokers is not endorsing or recommending any investment or trading discussed in the material. This material is not and should not be construed as an offer to buy or sell any security. It should not be construed as research or investment advice or a recommendation to buy, sell or hold any security or commodity. This material does not and is not intended to take into account the particular financial conditions, investment objectives or requirements of individual customers. Before acting on this material, you should consider whether it is suitable for your particular circumstances and, as necessary, seek professional advice.
Related Articles


Join The Conversation
For specific platform feedback and suggestions, please submit it directly to our team using these instructions.
If you have an account-specific question or concern, please reach out to Client Services.
We encourage you to look through our FAQs before posting. Your question may already be covered!