
- Solve real problems with our hands-on interface
- Progress from basic puts and calls to advanced strategies
Interactive Options Course

Posted June 9, 2026 at 9:29 am
nvestopedia is partnering with All Star Charts on this newsletter. The contents of this newsletter are for informational and educational purposes only.
The dollar in your wallet and the dollar on Wall Street disagree right now.
You know the first one. A strong dollar stretches your paycheck. A weak one shows up as higher prices at the pump and the grocery store, the slow squeeze most people call inflation. That instinct is correct, and it is the everyday version of something markets watch far more closely.
There is a way to measure the dollar’s strength in real time, called the U.S. Dollar Index, ticker DXY.
It tracks the dollar not against a basket of goods but against a basket of other major currencies, including the euro, the Japanese yen, and the British pound.
It is not the same thing as the inflation number you feel at the store. It is the market’s live read on how strong the dollar is against the rest of the world.
Here is why that matters for your money, even if you never trade a currency in your life.
The Dollar Index is one of the best tells in markets for whether investors feel brave or scared.
When money gets nervous, it runs toward the dollar for safety and the index rises. When money feels confident, it leaves that safety and spreads back into stocks, commodities, and other assets that do well when people take risk.
A rising dollar tends to mean money is playing defense, and a falling dollar tends to show up alongside stronger performance in risk assets.
That is why the chart below is worth your attention. For the past year, the Dollar Index has been stuck in a wide range, hovering just under one number that keeps mattering: 100.
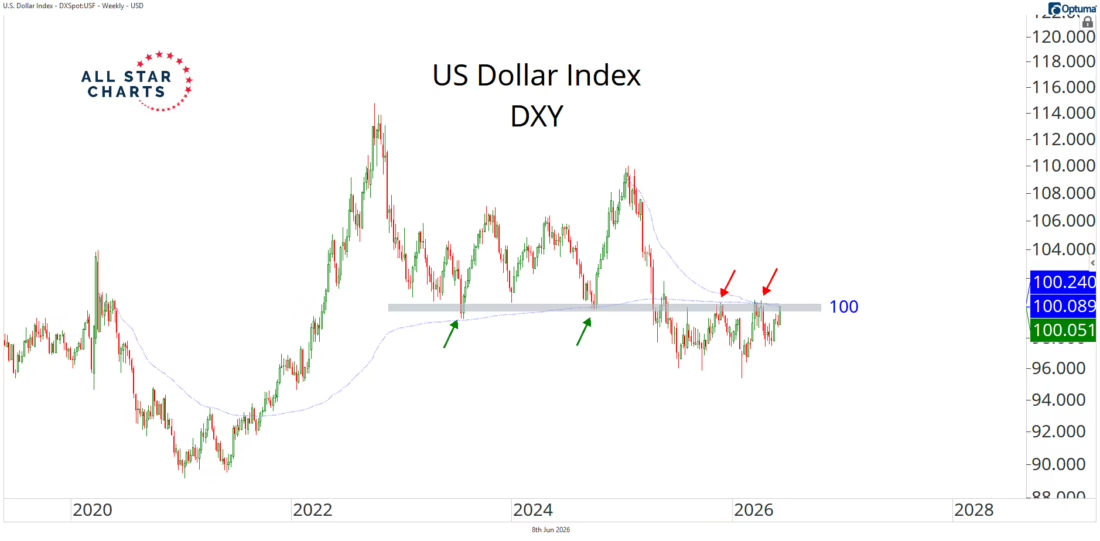
The 100 mark is what technicians call a polarity level, a price that has flipped roles over the years, acting as a floor at some points and a ceiling at others.
The market keeps treating it as a line worth defending.
Now the part that makes a level worth trusting, and the part you can use on any chart you ever look at.
Traders put more weight on a price when several independent measures point to the same spot. They call it confluence. One signal can be noise.
When two or three separate methods, calculated in completely different ways, all land on the same number, that agreement is hard to dismiss.
That is what is happening at 100. Two separate reference points are stacking up there.
One is the volume-weighted average price anchored from the COVID lows, and the other is the same measure anchored from last year’s highs.
Volume-weighted average price, or VWAP, is the average price an asset has traded at over a stretch of time, weighted by how much changed hands at each level, so it shows where the real money has been positioned.
Two versions of that measure, anchored to two different moments, both converge on 100. That is confluence, and it is why this zone is more than just a round number.
So this is the line in the sand. As long as the Dollar Index stays below 100, it points to a weaker-dollar backdrop where sellers stay in control, the kind of environment that has historically given stocks and other risk assets more room to run.
The concern comes if the dollar reclaims 100 decisively. Above that level, a strengthening dollar becomes a headwind for stocks, and the same force you feel as purchasing power at the store starts working against the risk side of your portfolio.
You do not need to trade currencies to use this.
You need to know which side of 100 the dollar sits on, and you need to know how to spot confluence when it shows up, because that is how you tell a level that matters from a number that does not.
That second skill, reading where the real money is positioned, is not just a big-picture tool. VWAP works on every timeframe, including the intraday charts active traders use to time entries to the minute.
Kenny Glick trades off that exact read, live, and he is breaking it down in a free session today at 1 pm ET.
To see how the same tool that defines the dollar’s line in the sand gets used in real time, register free and join Kenny live.
—
Originally posted 9th June 2026
Investopedia.com: The comments, opinions and analyses expressed herein are for informational purposes only and should not be considered individual investment advice or recommendations to invest in any security or to adopt any investment strategy. While we believe the information provided herein is reliable, we do not warrant its accuracy or completeness. The views and strategies described on our content may not be suitable for all investors. Because market and economic conditions are subject to rapid change, all comments, opinions and analyses contained within our content are rendered as of the date of the posting and may change without notice. The material is not intended as a complete analysis of every material fact regarding any country, region, market, industry, investment or strategy. This information is intended for US residents only.
Information posted on IBKR Campus that is provided by third-parties does NOT constitute a recommendation that you should contract for the services of that third party. Third-party participants who contribute to IBKR Campus are independent of Interactive Brokers and Interactive Brokers does not make any representations or warranties concerning the services offered, their past or future performance, or the accuracy of the information provided by the third party. Past performance is no guarantee of future results.
This material is from Investopedia and is being posted with its permission. The views expressed in this material are solely those of the author and/or Investopedia and Interactive Brokers is not endorsing or recommending any investment or trading discussed in the material. This material is not and should not be construed as an offer to buy or sell any security. It should not be construed as research or investment advice or a recommendation to buy, sell or hold any security or commodity. This material does not and is not intended to take into account the particular financial conditions, investment objectives or requirements of individual customers. Before acting on this material, you should consider whether it is suitable for your particular circumstances and, as necessary, seek professional advice.
There is a substantial risk of loss in foreign exchange trading. The settlement date of foreign exchange trades can vary due to time zone differences and bank holidays. When trading across foreign exchange markets, this may necessitate borrowing funds to settle foreign exchange trades. The interest rate on borrowed funds must be considered when computing the cost of trades across multiple markets.
Spot currencies are not available at IBKR Singapore.
Related Articles


Join The Conversation
For specific platform feedback and suggestions, please submit it directly to our team using these instructions.
If you have an account-specific question or concern, please reach out to Client Services.
We encourage you to look through our FAQs before posting. Your question may already be covered!