
- Solve real problems with our hands-on interface
- Progress from basic puts and calls to advanced strategies
Interactive Options Course
Posted April 11, 2025 at 9:45 am
1/ What is the Dollar Telling Us?
2/ DXY vs SPX + Correlation
3/ The VIX is Surging… but the DXY is Falling
4/ Gold Challenges the Dollar’s Role as a Safe Haven
5/ Semiconductors Test Key Support
Investopedia is partnering with CMT Association on this newsletter. The contents of this newsletter are for informational and educational purposes only, however, and do not constitute investing advice. The guest authors, which may sell research to investors, and may trade or hold positions in securities mentioned herein do not represent the views of CMT Association or Investopedia. Please consult a financial advisor for investment recommendations and services.
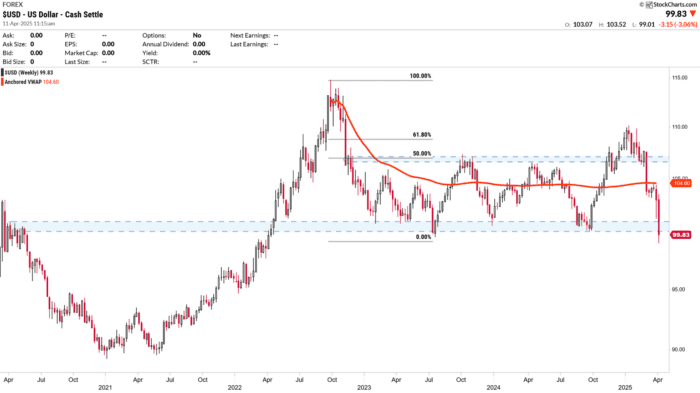
What Is the Dollar Telling Us?
The U.S. dollar has lost momentum just as markets begin to reassess the Fed’s monetary policy stance. The 100 level stands as the last line of defense for the bulls. A decisive break below it could open the door to levels not seen since mid-2021 (~98). A move below the key psychological threshold of 100 could signal a shift in intermarket leadership. Historically, this same zone has acted as a pivot point for rallies in commodities and risk assets. The market is now asking: Will the dollar continue to set the tone?
Courtesy of StockCharts.com
After falling from its 2022 high (~114), the DXY has traded within a broad range where markets felt comfortable pushing risk assets to new highs. The bounce off the late-2024 lows failed to reclaim the 61.8% Fibonacci retracement, reinforcing a medium-term bearish narrative.
The current key support lies between 100 and 101—a psychologically and technically significant zone that has provided a base on several occasions (May 2022, April 2023, December 2023, and now in April 2025).
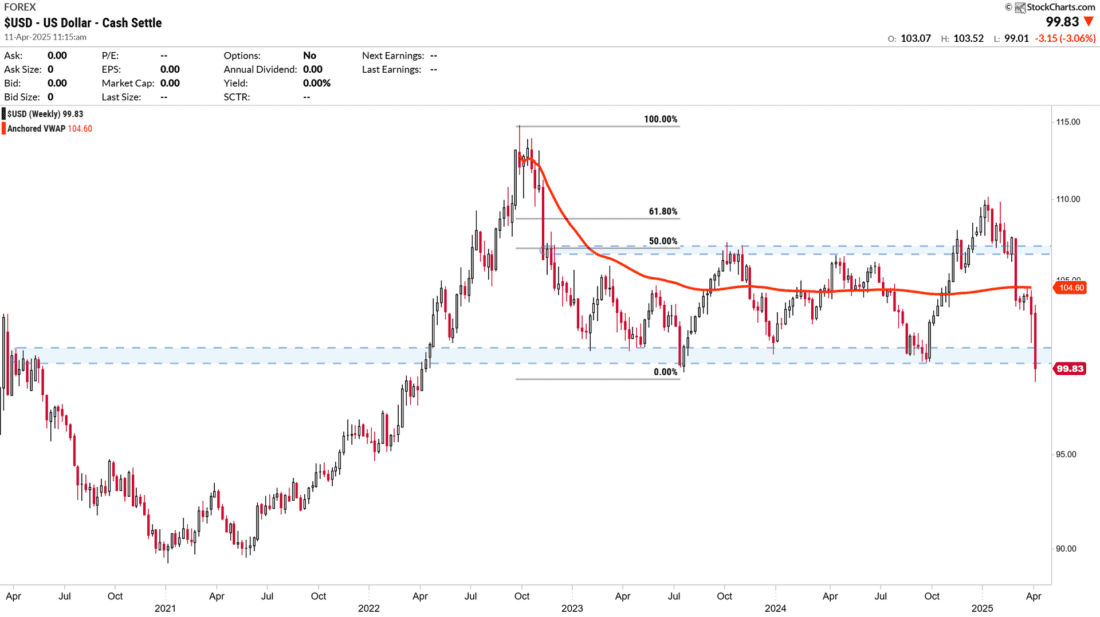
DXY vs SPX + Correlation
For the First Time in Months, the Dollar and the S&P 500 Are Falling in Tandem — A Sign of Structural Risk-Off
The current positive correlation — now at 0.66 — appears to be more a reflection of macroeconomic stress than a sign of healthy alignment. When the dollar and equities stop acting as offsets, the message is usually clear: investors are heading for the exits.
🔻 Both assets are falling:
The correlation indicator confirms it: USD and SPX have been moving in sync.
Courtesy of StockCharts.com
🧩 How Should We Interpret This Tandem Sell-Off?
🅰️ Scenario 1: Flight to Cash
Investors are liquidating both equities and dollars — a sign of extreme risk aversion. Capital is moving directly into cash or alternative safe havens (gold, sovereign bonds, etc.).
🅱️ Scenario 2: Broad-Based Macro Repricing
Markets are simultaneously reassessing:
This dual repricing is driving downside pressure on both the dollar (loss of carry advantage) and equities (falling earnings expectations).
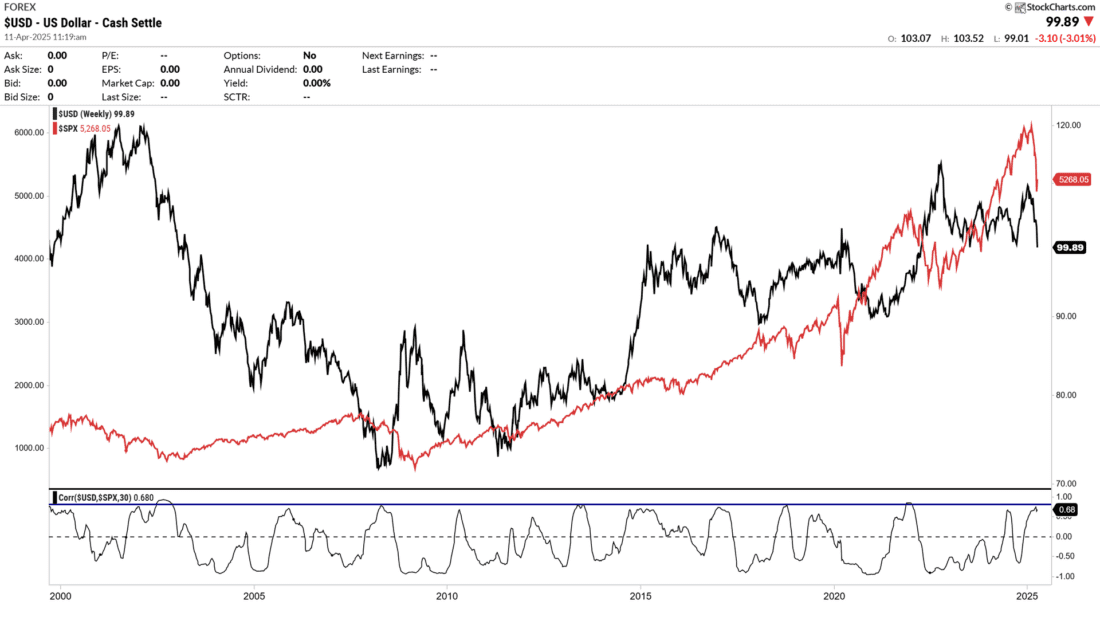
The VIX is Surging… but the DXY is Falling
Despite a sharp spike in volatility, the DXY is not responding with strength as it did in previous crises. This suggests that the market may be interpreting current risk dynamics as qualitatively different, or that the dollar is no longer seen as an unconditional safe haven.
If downward pressure on the DXY persists while the VIX remains elevated, we could witness a breakdown of key support in the U.S. dollar index — reinforcing the idea of a structural shift in intermarket leadership.
Courtesy of StockCharts.com
This breaks the traditional relationship between these two indicators and could be interpreted as:
Gold Challenges the Dollar’s Role as a Safe Haven
Across multiple cycles (2001, 2008, 2020), there has been a clear negative correlation: when the dollar falls, gold rises. Of Course, this is typical behavior since gold is priced in USD, a weaker dollar makes gold cheaper for foreign buyers, boosting demand.
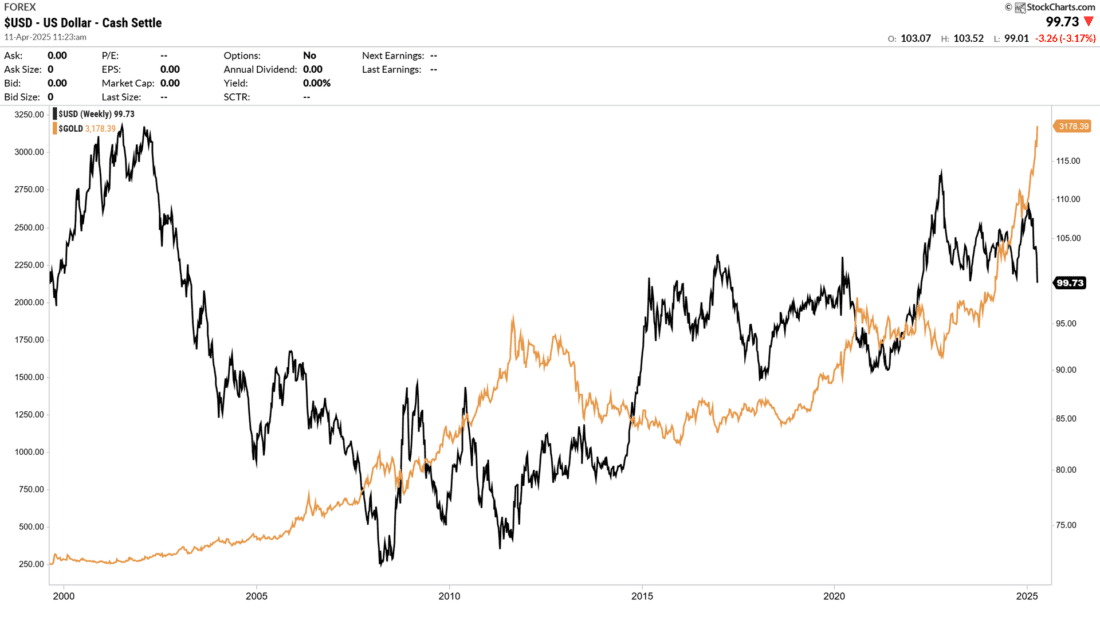
Courtesy of StockCharts.com
Since 2022 a partial breakdown in that Relationship. Even during periods of dollar strength, gold has continued to rise aggressively, especially from 2023 to 2025. This suggests that gold no longer relies solely on dollar weakness to appreciate.
Potential drivers behind this dynamic include:
Steepening After Inversion — What the Bond Market Is Telling Us
📊 Technical Take:
1.
The 10Y–2Y yield spread has emerged from a deep inversion. The curve reached a low of -1.06%, one of the deepest inversions in recent decades. It now sits at +0.55%, confirming a return to positive slope (steepening).This is typically the second phase of the yield curve cycle — when the curve un-inverts right before or during a recession.
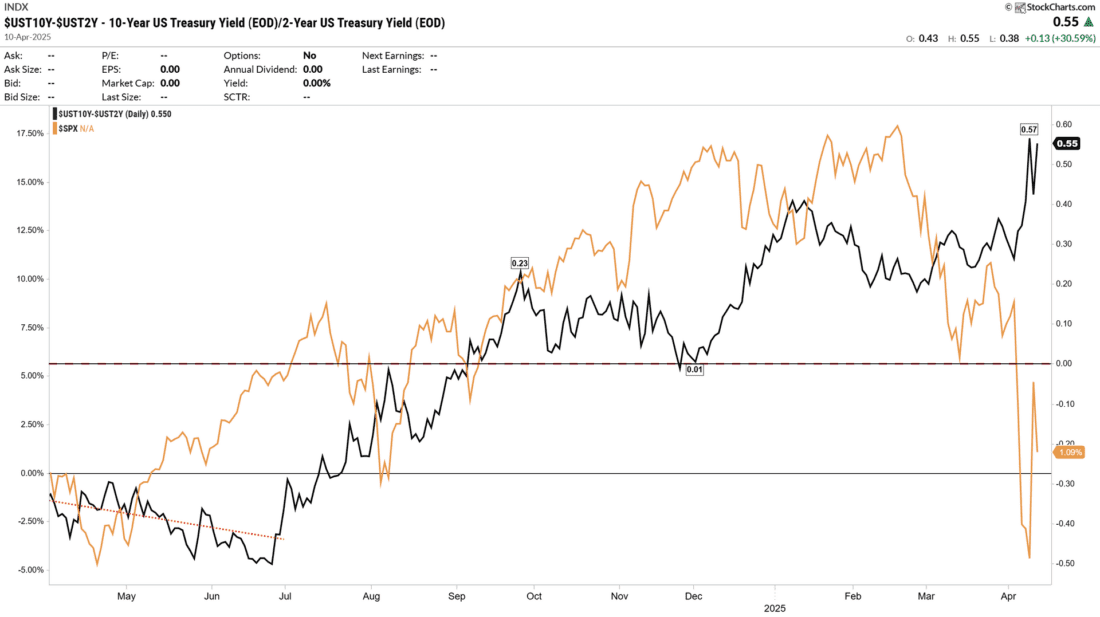
Courtesy of StockCharts.com
2. Historical context: post-inversion ≠ relief. In previous cycles (2000, 2006, 2019), the yield curve normalized before equity markets experienced significant drawdowns. A steepening curve has historically been a lagging signal, not a sign of resolution.
Intermarket signals appear to be aligning: a weakening dollar, a yield curve steepening after a historic inversion, and gold pushing to new highs. Taken together, these moves suggest that the market may be entering a new phase—one potentially defined by rising risk aversion, a shift in macro leadership, and a redefinition of traditional safe-haven assets.
However, the decisive factor may lie in the political arena: the course the United States takes on fiscal, monetary, and trade policy—including the potential implementation of new tariffs—could ultimately determine the next major move in global markets.
—
Originally posted 11 April 2025
Investopedia.com: The comments, opinions and analyses expressed herein are for informational purposes only and should not be considered individual investment advice or recommendations to invest in any security or to adopt any investment strategy. While we believe the information provided herein is reliable, we do not warrant its accuracy or completeness. The views and strategies described on our content may not be suitable for all investors. Because market and economic conditions are subject to rapid change, all comments, opinions and analyses contained within our content are rendered as of the date of the posting and may change without notice. The material is not intended as a complete analysis of every material fact regarding any country, region, market, industry, investment or strategy. This information is intended for US residents only.
Information posted on IBKR Campus that is provided by third-parties does NOT constitute a recommendation that you should contract for the services of that third party. Third-party participants who contribute to IBKR Campus are independent of Interactive Brokers and Interactive Brokers does not make any representations or warranties concerning the services offered, their past or future performance, or the accuracy of the information provided by the third party. Past performance is no guarantee of future results.
This material is from Investopedia and is being posted with its permission. The views expressed in this material are solely those of the author and/or Investopedia and Interactive Brokers is not endorsing or recommending any investment or trading discussed in the material. This material is not and should not be construed as an offer to buy or sell any security. It should not be construed as research or investment advice or a recommendation to buy, sell or hold any security or commodity. This material does not and is not intended to take into account the particular financial conditions, investment objectives or requirements of individual customers. Before acting on this material, you should consider whether it is suitable for your particular circumstances and, as necessary, seek professional advice.
There is a substantial risk of loss in foreign exchange trading. The settlement date of foreign exchange trades can vary due to time zone differences and bank holidays. When trading across foreign exchange markets, this may necessitate borrowing funds to settle foreign exchange trades. The interest rate on borrowed funds must be considered when computing the cost of trades across multiple markets.
U.S. Spot Gold trading through IB LLC accounts is only available to legal residents of the United States that do not reside in Arizona, Montana, New Hampshire, and Rhode Island.
Futures are not suitable for all investors. The amount you may lose may be greater than your initial investment. Before trading futures, please read the CFTC Risk Disclosure. A copy and additional information are available at ibkr.com.
Spot currencies are not available at IBKR Singapore.
Related Articles


")


Join The Conversation
For specific platform feedback and suggestions, please submit it directly to our team using these instructions.
If you have an account-specific question or concern, please reach out to Client Services.
We encourage you to look through our FAQs before posting. Your question may already be covered!