
- Solve real problems with our hands-on interface
- Progress from basic puts and calls to advanced strategies
Interactive Options Course

Posted May 7, 2026 at 11:18 am
The common question about large language models in markets is whether they can predict prices. A more important risk question is whether they can make a large number of investors interpret the same information in the same way, at the same time. LLMs may become market-relevant not because they create perfect forecasts, but because they compress diverse research processes into similar narratives, rankings, watchlists and execution plans. This note argues that LLM-based trading systems can plausibly increase volatility through a simple chain: belief homogenization, trade clustering, crowding, liquidity commonality and mechanical feedback from stop losses, volatility targeting and index-option hedging. The empirical literature does not yet prove that LLMs are already a dominant volatility driver. It does, however, provide strong adjacent evidence: strategic homogeneity raises mini-crash risk, algorithmic trading can make liquidity co-move, GenAI availability appears to synchronize retail beliefs, and crowded trades are associated with downside instability.
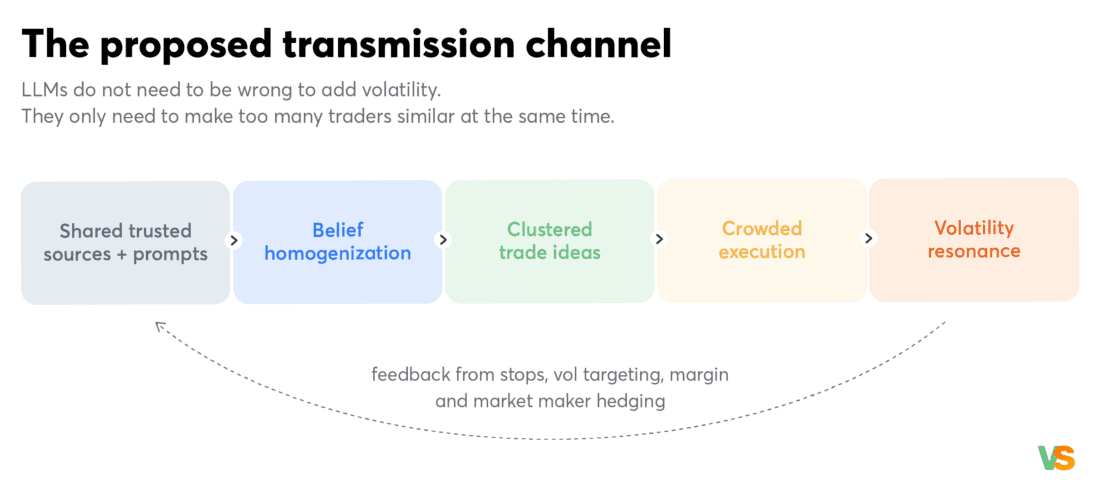
Figure 1. The proposed transmission channel from LLM-mediated research to volatility resonance. Source: Visual Sectors
The original intuition is straightforward: LLMs tend to act as belief homogenizers. A trader asks for the most important macro risks, the likely winners from a policy change, the best pairs trade in a sector, or a Python backtest template. The answer can look personalized, but the underlying sources, model priors and reasoning paths are often shared. If many users ask similar questions after the same news event, the distribution of conclusions can become narrower than it would be in a market populated by independent analysts.
That matters because volatility is not only a function of information. It is also a function of how many participants respond to information in a correlated way. If one trader changes a view, the market absorbs it. If many similar systems rebalance together, the same view can become a flow. If that flow meets thin liquidity, the price move can overshoot the information. If the overshoot then triggers stop losses, margin cuts, volatility controls, or dealer hedging, the amplitude can become larger than the initial news justified.
The danger is therefore not that AI systems are always wrong. They may be directionally reasonable. The risk is that many reasonable systems can become reasonable in the same direction, at the same time, through the same instruments. Similarity is a hidden form of leverage.
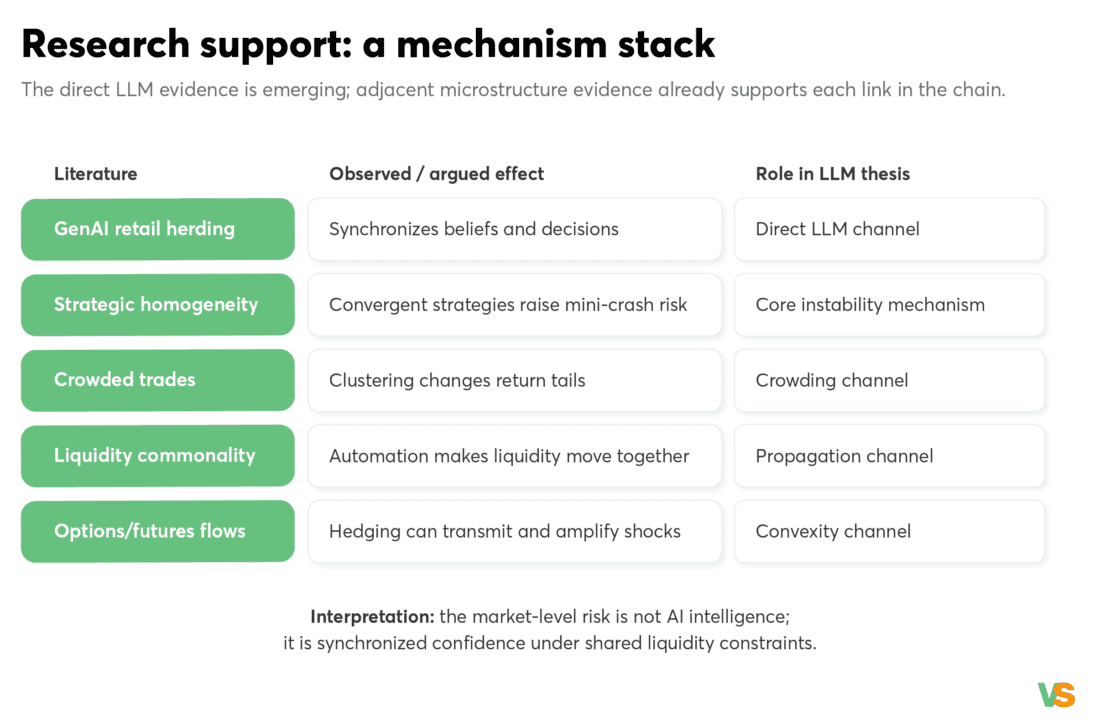
Figure 2. The LLM-volatility thesis is a stack of related mechanisms rather than a single-paper claim. Source: Visual Sectors
Financial markets have always had shared narratives. What is new is the combination of conversational interfaces, code generation, retrieval and automated execution. LLMs do not just distribute an opinion; they can translate that opinion into a portfolio screen, a risk model, a backtest, an options expression, and a rebalancing script. The model can move from narrative to implementation in one workflow.
This is why the 2026 SSRN preprint When ChatGPT Stops Talking: GenAI-induced Retail Herding and Systematic Risk is so relevant. Using unexpected ChatGPT outages as shocks to GenAI availability, Xiaoxue He argues that ChatGPT acts as a belief homogenizer, synchronizing retail beliefs and trading decisions. The key point is not that retail investors become smarter or less smart. The key point is that they become more synchronized.
A simple example is a central-bank speech. One analyst may focus on rates, another on earnings sensitivity, another on currency translation, and another on positioning. An LLM-assisted workflow can surface all of these channels, but it may rank them similarly for many users. Ranking matters because the first explanation often becomes the trade.
The strongest adjacent evidence comes from strategic homogeneity and crowded-trade research. Liu, Miao, Wang and Wang, in Strategic Homogeneity in Trading: Amplifying Market Volatility and the Emergence of Mini-Crashes, argue that convergence of trading strategies can amplify volatility and increase mini-crash risk. The connection to LLM-based trading is direct: if many agents use similar models, similar sources and similar decision templates, the market may not become more intelligent in aggregate. It may become more uniform.
Crowded Trades, Market Clustering, and Price Instability reaches the same intuition from granular trading data. The authors study how similarly trading peers influence price dynamics and show that market clustering affects the tails of return distributions. In plain English: who trades together matters. It is not enough to know whether a trade is fundamentally justified; we also need to know how crowded that expression has become.
Crowding also has two dimensions. There is idea crowding, where many investors believe the same story, and expression crowding, where they use the same instrument, horizon or exit rule. LLMs can intensify the first dimension; modern execution technology can intensify the second. Volatility risk appears when both dimensions line up.

Figure 3. Crowding can show up in the shape of return distributions, especially the left tail.
The next step is propagation. Even if LLMs begin as research tools, the trade still enters an automated market. Execution algorithms, market makers, systematic risk controls, and futures liquidity all respond to flow. This is why Algorithmic Trading and Liquidity Commonality is useful for the argument. Huh finds that the NYSE hybridization event increased 5-minute liquidity co-movement by 30-50% and daily liquidity co-movement by 90%. Automation did not simply change individual trades; it made liquidity conditions move together more.
That is the bridge from micro to macro. LLMs may influence the idea-generation layer, while automated trading infrastructure influences the execution and liquidity layer. If both layers become more synchronized, volatility can rise even without a new fundamental shock. The market starts reacting not only to information, but also to the similarity of how information has been processed.
This is also why signal backtests are not enough. A backtest can tell us whether a signal worked historically; it cannot easily tell us whether too many future users will discover the same signal, express it through the same liquidity channel, and exit at the same volatility threshold.

Figure 4. Automation can increase commonality in liquidity conditions, creating a propagation channel for clustered flow.
The final layer is convexity. AI-assisted trade ideas are likely to be expressed through liquid index instruments, SPX options, single-name options, or equity-index futures because these instruments are fast, accessible and capital efficient. Research on retail options trading and market-maker hedging suggests that this layer can transmit activity in derivatives into volatility in underlying securities. Lipson, Tomio and Zhang, for example, find evidence that retail option trading increased volatility in underlying securities, with market-maker hedging as a likely mechanism.
The 0DTE literature adds nuance. Dim, Eraker and Vilkov study same-day expiry S&P 500 index options and find that market-maker gamma inventory is related to future intraday volatility and price reversal or momentum dynamics. The correct takeaway is not that all short-dated option activity is automatically destabilizing. The takeaway is that positioning, hedging and inventory state matter. In a synchronized LLM environment, those states become more important because flow can arrive in bursts.

Figure 5. Options and futures execution can turn a synchronized research idea into a feedback loop. Source: Visual Sectors
The practical response is not to avoid AI. It is to avoid synchronized fragility. First, use shorter-window volatility-based position sizing. A 6-12 month calibration window is often more responsive than long historical averages when market structure is changing quickly. The objective is not to predict every spike, but to reduce size before rising realized volatility forces a disorderly exit.
Second, pay attention to portfolio composition. Market-neutral frameworks can be particularly useful when the source of risk is not just direction, but amplitude. A market-neutral book can still be crowded, but it reduces dependence on a single beta shock and forces the research process to think in cross-sectional terms.
Third, monitor narrative crowding. The modern risk dashboard should include more than price, volume and volatility. It should ask whether too many agents are reading the same story, using the same summary, and expressing the same trade through the same liquid instruments. Useful warning signs include concentrated news attention, rising similarity across research summaries, heavy flow into the same option maturities, widening intraday realized volatility and a sudden loss of depth in index futures.

Figure 6. The most fragile environment combines high narrative synchrony with weak liquidity resilience. Source: Visual Sectors
LLMs may improve individual research productivity while weakening market-level diversity. That is the paradox. A better research assistant can still produce a more fragile market if it causes beliefs, trades and exits to converge.
The thesis is not that LLMs will cause every volatility spike. The thesis is that they can increase the probability that information shocks become synchronized flow shocks. In markets, similarity is a hidden form of leverage. When enough investors think together, trade together and de-risk together, the same level of information can produce sharper swings.
For systematic investors, the answer is not less technology. It is better measurement of crowding, liquidity, positioning and volatility state before AI-generated ideas reach the portfolio.
Visit Visual Sectors for info on data processing via API.
[1] Dim, C., Eraker, B. and Vilkov, G. (2025). 0DTEs: Trading, Gamma Risk and Volatility Propagation. SSRN.
[2] He, X. (2026). When ChatGPT Stops Talking: GenAI-induced Retail Herding and Systematic Risk. SSRN preprint.
[3] Huh, Y. (2011/2013). Algorithmic Trading and Liquidity Commonality. SSRN.
[4] Jain, K., Conlon, T. and Cotter, J. (2024). Crowding and Downside Risk: International Evidence. SSRN.
[5] Lipson, M. L., Tomio, D. and Zhang, J. (2023). A Real Cost of Free Trades: Retail Option Trading Increases the Volatility of Underlying Securities. SSRN.
[6] Liu, Q., Miao, D., Wang, C. and Wang, C. D. (2025). Strategic Homogeneity in Trading: Amplifying Market Volatility and the Emergence of Mini-Crashes. SSRN.
[7] van Kralingen, M., Garlaschelli, D., Scholtus, K. and van Lelyveld, I. (2021). Crowded Trades, Market Clustering, and Price Instability. Entropy.
Information posted on IBKR Campus that is provided by third-parties does NOT constitute a recommendation that you should contract for the services of that third party. Third-party participants who contribute to IBKR Campus are independent of Interactive Brokers and Interactive Brokers does not make any representations or warranties concerning the services offered, their past or future performance, or the accuracy of the information provided by the third party. Past performance is no guarantee of future results.
This material is from Visual Sectors and is being posted with its permission. The views expressed in this material are solely those of the author and/or Visual Sectors and Interactive Brokers is not endorsing or recommending any investment or trading discussed in the material. This material is not and should not be construed as an offer to buy or sell any security. It should not be construed as research or investment advice or a recommendation to buy, sell or hold any security or commodity. This material does not and is not intended to take into account the particular financial conditions, investment objectives or requirements of individual customers. Before acting on this material, you should consider whether it is suitable for your particular circumstances and, as necessary, seek professional advice.
Options involve risk and are not suitable for all investors. For information on the uses and risks of options, you can obtain a copy of the Options Clearing Corporation risk disclosure document titled Characteristics and Risks of Standardized Options by going to the following link ibkr.com/occ. Multiple leg strategies, including spreads, will incur multiple transaction costs.
Futures are not suitable for all investors. The amount you may lose may be greater than your initial investment. Before trading futures, please read the CFTC Risk Disclosure. A copy and additional information are available at ibkr.com.


Join The Conversation
For specific platform feedback and suggestions, please submit it directly to our team using these instructions.
If you have an account-specific question or concern, please reach out to Client Services.
We encourage you to look through our FAQs before posting. Your question may already be covered!