
- Solve real problems with our hands-on interface
- Progress from basic puts and calls to advanced strategies
Interactive Options Course
Posted July 3, 2025 at 10:41 am
1/ MTUM Breaks Out of Long-Term Base
2/ Risk-On Environment
3/ Large-Cap Growth Coiled for Breakout
4/ Small-Cap Value Joins the Risk-On Rotation with Breakout Attempt
Investopedia is partnering with CMT Association on this newsletter. The contents of this newsletter are for informational and educational purposes only, however, and do not constitute investing advice. The guest authors, which may sell research to investors, and may trade or hold positions in securities mentioned herein do not represent the views of CMT Association or Investopedia. Please consult a financial advisor for investment recommendations and services.
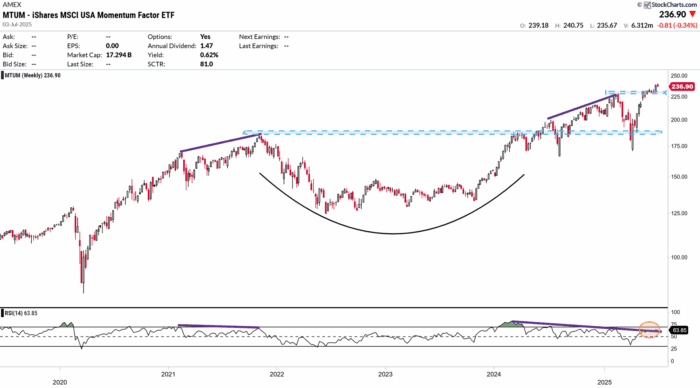
MTUM Breaks Out of Long-Term Base
The iShares MSCI USA Momentum Factor ETF (MTUM) has completed a textbook cup-with-handle formation on the weekly chart, breaking decisively above the key resistance zone near $200–$210—a level that had capped price action since early 2022. This breakout validates a long-term bullish structure and favors continued strength in momentum-oriented equities.
The ETF formed a well-defined “cup” bottoming in 2022–2023, followed by a shallow “handle” consolidation around $225, now resolved to the upside.
The breakout has propelled prices to new all-time highs, with MTUM currently trading at $236.90.
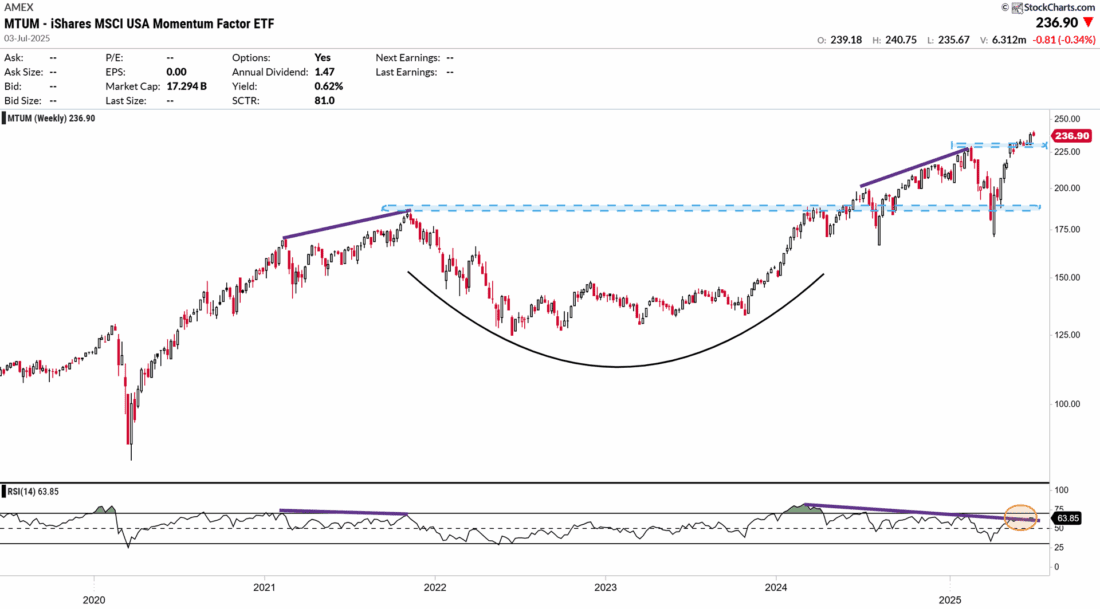
📉 Momentum Divergence Signals Potential Pause
Despite the bullish breakout, the weekly RSI is flashing a bearish divergence. While price continues to set higher highs. The current RSI reading stands at 63.85, below overbought levels, but unable (so far) to break its own downtrend line (highlighted in orange). This divergence suggests that momentum is fading, even as price advances.
The breakout from the multi-year base is a clear bullish development, but fading relative strength warns of potential short-term exhaustion. This does not invalidate the breakout but raises the likelihood of a consolidation or pullback phase before the next leg higher.
Potential upside target: $250–$260 based on technical extensions.
Defensive Sectors Underperforming Suggest a Risk-On Environment
The relative performance chart of defensive sectors—Consumer Staples (XLP), Utilities (XLU), Health Care (XLV), and Real Estate (XLRE)—versus the S&P 500 (SPY) shows a clear pattern of underperformance across all lines.
🔻 Key Observations:
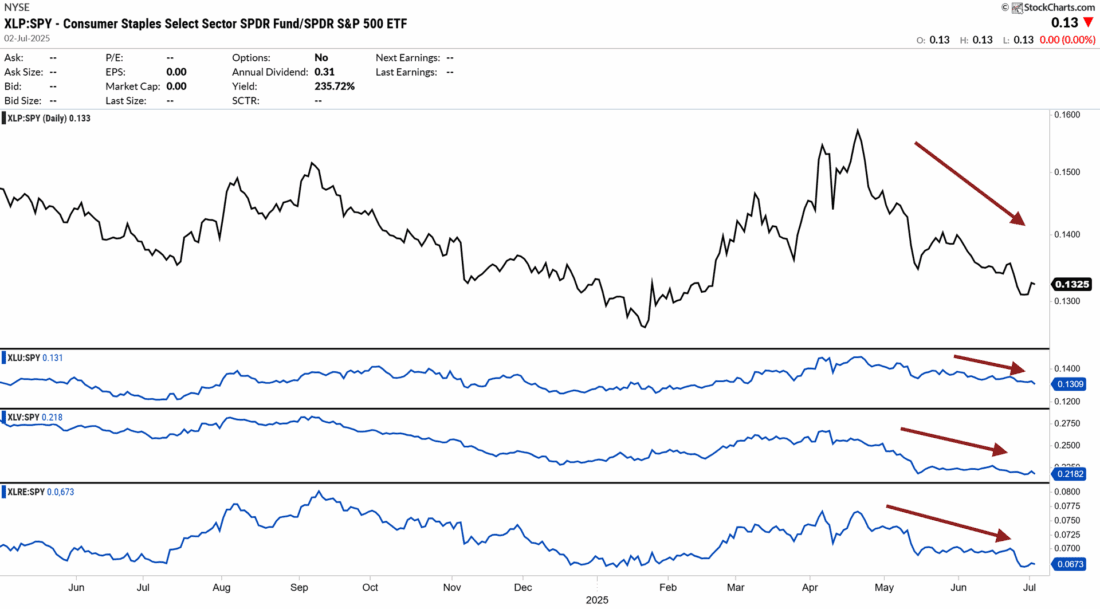
This broad-based weakness in defensive sectors contrasts sharply with the MTUM breakout analyzed earlier—where momentum stocks are hitting all-time highs and validating bullish patterns.
The simultaneous breakout in momentum (MTUM) and weakness in defensive sectors supports a classic “Risk-On” regime:
This regime shift favors cyclical sectors and high-momentum strategies, while defensive exposure may lag.
Large-Cap Growth Coiled for Breakout — Confirms Risk-On Rotation
The Dow Jones US Large-Cap Growth Index ($DJUSGL) is pressing against multi-year resistance near the 8,750–8,800 level, a zone that previously capped price advances in late 2021 and early 2025. The structure reveals two distinct cup formations: a large multi-year base from 2021–2023, and a shorter-term cup from early 2025.
The index has been bouncing within a wide range since the 2000s, with a failed breakout in 2007 where it was unable to move beyond the 15,000 level. Recently, the index has broken through this resistance once again, drawing attention as investors watch to see whether it can sustain the move and reach higher levels this time.
Price is approaching all-time highs, having recovered sharply from the Q1 2025 pullback. The dual cup-shaped bases show that buyers have persistently accumulated growth exposure during drawdowns.
A breakout above resistance could unleash a fresh leg higher.
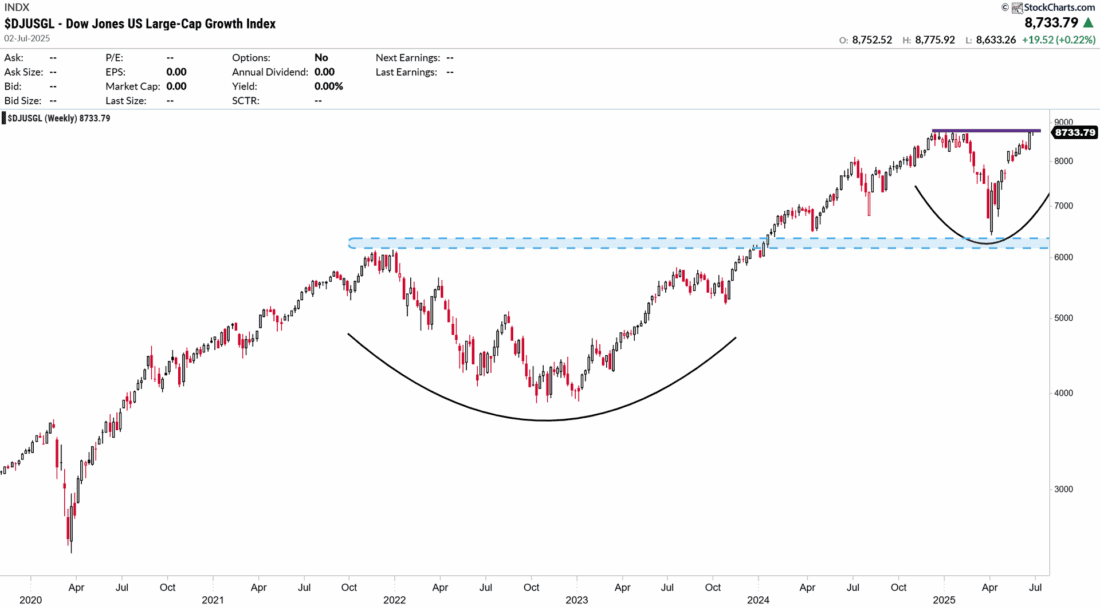
This chart reinforces and validates the conclusions drawn from the MTUM and sector rotation charts:
The breakout in momentum stocks (MTUM) shows that investors are rewarding trend strength and growth leadership. It’s a leading signal of bullish sentiment. As shown previously, defensive sectors are underperforming SPY. This sector rotation away from safety is classic Risk-On behavior.
The Large-Cap Growth Index is now aligning with this regime — setting up for leadership participation, a necessary condition for strong bull markets. If resistance is cleared, growth stocks could become the dominant force in the second half of 2025.
Small-Cap Value Joins the Risk-On Rotation with Breakout Attempt
The Dow Jones US Small-Cap Value Index ($DJUSVS) has recently broken above a major horizontal resistance that had capped prices since mid-2021. This multi-year ceiling, around the 4,900 level, was tested multiple times without success — until now. The breakout marks a significant shift in sentiment and confirms broader participation in the current rally.

The index formed a 2+ year consolidation base, essentially a large accumulation rectangle. The Q1 2025 correction found support near the 61.8% Fibonacci retracement, followed by a strong rebound. Price has now reclaimed former highs and is holding above 5,060, confirming a bullish breakout structure.
This breakout adds another critical layer to the Risk-On thesis established by the prior charts. Now joining the move with a clear breakout, suggesting broadening market breadth and participation from less crowded areas of the market.
The simultaneous strength in momentum, growth, and now small-cap value confirms broad market participation — a key hallmark of sustainable Risk-On environments. With defensive sectors lagging and multiple leadership groups emerging, the market is sending a clear signal: investors are embracing risk.
—
Originally posted 3rd July 2025
Investopedia.com: The comments, opinions and analyses expressed herein are for informational purposes only and should not be considered individual investment advice or recommendations to invest in any security or to adopt any investment strategy. While we believe the information provided herein is reliable, we do not warrant its accuracy or completeness. The views and strategies described on our content may not be suitable for all investors. Because market and economic conditions are subject to rapid change, all comments, opinions and analyses contained within our content are rendered as of the date of the posting and may change without notice. The material is not intended as a complete analysis of every material fact regarding any country, region, market, industry, investment or strategy. This information is intended for US residents only.
Information posted on IBKR Campus that is provided by third-parties does NOT constitute a recommendation that you should contract for the services of that third party. Third-party participants who contribute to IBKR Campus are independent of Interactive Brokers and Interactive Brokers does not make any representations or warranties concerning the services offered, their past or future performance, or the accuracy of the information provided by the third party. Past performance is no guarantee of future results.
This material is from Investopedia and is being posted with its permission. The views expressed in this material are solely those of the author and/or Investopedia and Interactive Brokers is not endorsing or recommending any investment or trading discussed in the material. This material is not and should not be construed as an offer to buy or sell any security. It should not be construed as research or investment advice or a recommendation to buy, sell or hold any security or commodity. This material does not and is not intended to take into account the particular financial conditions, investment objectives or requirements of individual customers. Before acting on this material, you should consider whether it is suitable for your particular circumstances and, as necessary, seek professional advice.
Any discussion or mention of an ETF is not to be construed as recommendation, promotion or solicitation. All investors should review and consider associated investment risks, charges and expenses of the investment company or fund prior to investing. Before acting on this material, you should consider whether it is suitable for your particular circumstances and, as necessary, seek professional advice.
Related Articles


Join The Conversation
For specific platform feedback and suggestions, please submit it directly to our team using these instructions.
If you have an account-specific question or concern, please reach out to Client Services.
We encourage you to look through our FAQs before posting. Your question may already be covered!