
- Solve real problems with our hands-on interface
- Progress from basic puts and calls to advanced strategies
Interactive Options Course
Latest Webinars
Posted June 24, 2025 at 6:16 am
From SIA Charts
1/ Lennox International Inc. (LII)
2/ SIA Matrix Overlay
3/ Point and Figure Chart
Investopedia is partnering with CMT Association on this newsletter. The contents of this newsletter are for informational and educational purposes only, however, and do not constitute investing advice. The guest authors, which may sell research to investors, and may trade or hold positions in securities mentioned herein do not represent the views of CMT Association or Investopedia. Please consult a financial advisor for investment recommendations and services.
Lennox International Inc. (LII)
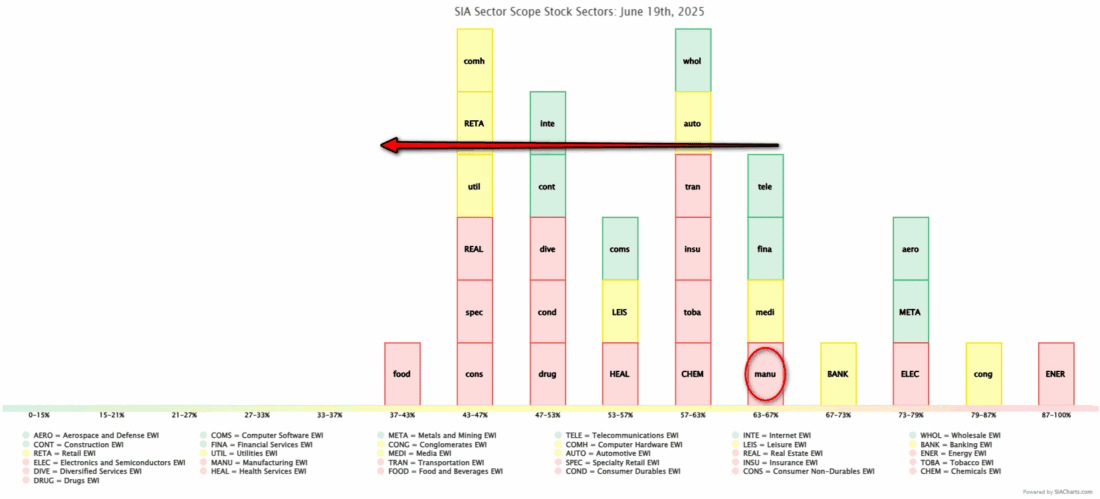
Yesterday’s report highlighted a notable shift in market breadth, with only 9 of 31 sectors maintaining positive bullish percent readings. This may indicate a transition from broad strength to a more selective and technically uneven environment. Within this context, manufacturing has become an area of concern.
Once supported by broader market momentum, the sector has now moved into an unfavored position from a relative strength perspective, suggesting underperformance relative to its peers. In addition, its bullish percent index has turned negative, retreating from relatively lofty levels. This may imply that a growing number of manufacturing stocks have shifted into bearish formations on their point-and-figure charts. With market leadership becoming more concentrated, the weakening technical posture in manufacturing perhaps reflects diminished sponsorship and rising internal pressure.
SIA Matrix Overlay
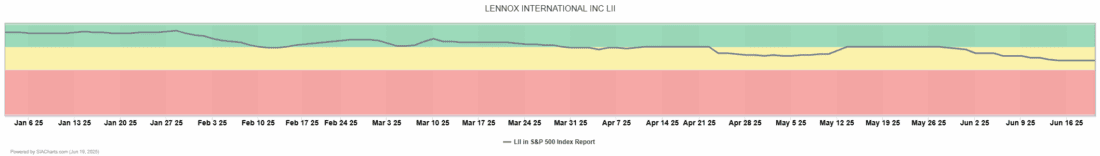
After scouring the SIA Manufacturing Index Report and training the eye on relative strength decliners, we discover Lennox International (LII), which is down 12 spots in the last month and 16 positions in the past quarter. It is now a decliner within a sector that itself is also losing relative strength. This is set against a backdrop of a stock that enjoyed the exact opposite for some time, when it was an outperforming name within an outperforming sector. With the SIA matrix overlay tool engaged, we can see the color coding of this green period where shares moved up from $280 all the way to $680 before beginning to consolidate down as far as $500, where they found support on two occasions.
Point and Figure Chart
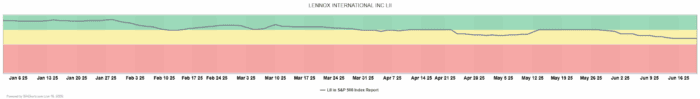
During this period, however, shares have also been moving down the rankings of the reports they appear in, most notably the SIA S&P 500 Index Report. Currently, shares are trading around the $550 level and may be vulnerable to any market pullbacks given both the weak relative strength of the sector and the stock itself.
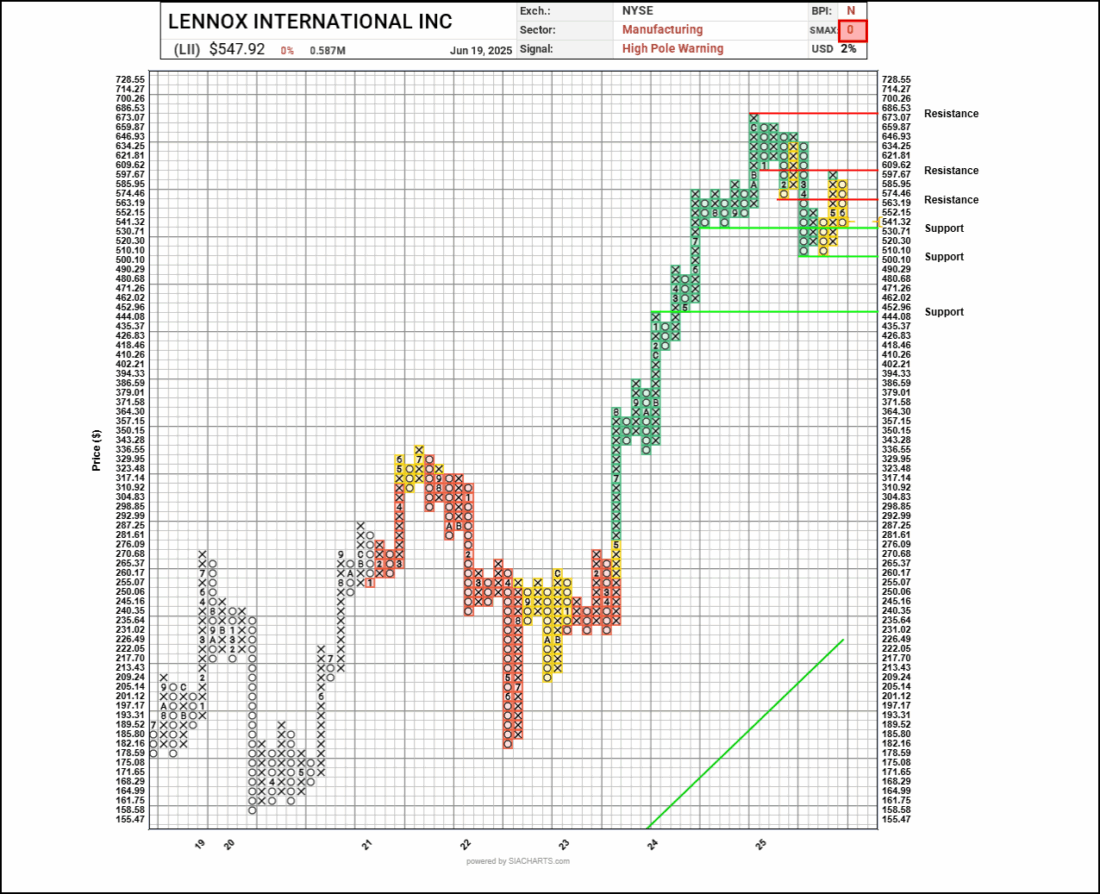
One final piece of data-driven insight is the near-term measure of relative strength against alternate asset classes, which SIA calls the SMAX score. Here, a reading is taken against a basket of other asset classes and presented as a number from 0 to 10. In the case of LII, that number is currently 0. Resistance for LII may initially be at the 3-box reversal level of $574.46, followed by $609.62 and the top line at $686.53. Support, on the other hand, may initially materialize at $530.71, $500.10, and another level of prior support at $444.08.
—
Originally posted 20th June 2025
Investopedia.com: The comments, opinions and analyses expressed herein are for informational purposes only and should not be considered individual investment advice or recommendations to invest in any security or to adopt any investment strategy. While we believe the information provided herein is reliable, we do not warrant its accuracy or completeness. The views and strategies described on our content may not be suitable for all investors. Because market and economic conditions are subject to rapid change, all comments, opinions and analyses contained within our content are rendered as of the date of the posting and may change without notice. The material is not intended as a complete analysis of every material fact regarding any country, region, market, industry, investment or strategy. This information is intended for US residents only.
Information posted on IBKR Campus that is provided by third-parties does NOT constitute a recommendation that you should contract for the services of that third party. Third-party participants who contribute to IBKR Campus are independent of Interactive Brokers and Interactive Brokers does not make any representations or warranties concerning the services offered, their past or future performance, or the accuracy of the information provided by the third party. Past performance is no guarantee of future results.
This material is from Investopedia and is being posted with its permission. The views expressed in this material are solely those of the author and/or Investopedia and Interactive Brokers is not endorsing or recommending any investment or trading discussed in the material. This material is not and should not be construed as an offer to buy or sell any security. It should not be construed as research or investment advice or a recommendation to buy, sell or hold any security or commodity. This material does not and is not intended to take into account the particular financial conditions, investment objectives or requirements of individual customers. Before acting on this material, you should consider whether it is suitable for your particular circumstances and, as necessary, seek professional advice.
Related Articles


")

Join The Conversation
For specific platform feedback and suggestions, please submit it directly to our team using these instructions.
If you have an account-specific question or concern, please reach out to Client Services.
We encourage you to look through our FAQs before posting. Your question may already be covered!