
- Solve real problems with our hands-on interface
- Progress from basic puts and calls to advanced strategies
Interactive Options Course

Posted May 20, 2025 at 9:45 am
“We have gold because we cannot trust governments.” -Herbert Hoover
Gold’s rapid ascent to new record highs calls into question future returns. But when it comes to owning gold, investors should also ask whether gold can outperform bonds or equities, or both?
To answer this, we assess the fundamental drivers of gold’s bull run since 2022. The U.S. Federal Reserve (“Fed”) cutting cycle, sticky inflation, uncertainty and U.S. dollar (“USD”) diversification have been the key drivers since 2022.
We also discuss gold’s role as an inflation hedge, along with tactical tailwinds going forward, namely stagflation (slow growth and rising prices), recession risk and diminishing U.S. exceptionalism.
Finally, we identify the macro risk scenarios for gold outperformance and catalysts for underperformance. Stagflation is arguably the most favorable scenario, the end of inflation fear and trade wars the least.
While some consolidation near-term is possible, gold remains positioned to continue outperforming against a backdrop of sticky inflation, recession risk, de-dollarization (reduced reliance on the U.S. dollar) and budget deficits. These tailwinds are also long-term themes, strengthening the strategic case for gold as investors look to hedge USD and fixed income exposures.
Source: Bloomberg, BMO GAM, January 2025.
There are four factors driving gold’s bull run since 2022.
Fed rate cut cycle: Cross-asset correlations—low equity, negative USD and positive bond correlations—not only enable gold as an effective portfolio diversifier but also explain gold’s strong returns around Fed cutting cycles (Figure 1, 2). Markets started pricing in the latest rate cut cycle in late 2022 when the Fed started slowing the pace of hikes, allowing USD and real yields to peak, sending gold higher. Since peak hawkishness in late 2022, gold has returned around 100%; since the last rate hike and the first rate cut, gold climbed 70% and 25%, respectively.

Source: Bloomberg, BMO GAM. Monthly data since 1988, as at April 2025.
Sticky inflation: As economies avoided recessions, inflation remains above central bank 2% targets. Resilient growth and ongoing fiscal deficits mean sticky inflation and a higher for longer interest rate regime, keeping inflation fear alive and driving demand for hedges like gold.
Uncertainty: Gold has a history of outperforming during geopolitical or policy shocks. Russia invasion of Ukraine in 2022 and Israel-Hamas conflict in 2023 saw gold returns average 7% within the first two weeks, outperforming both equities and bonds. Gold also outperformed during the latest trade war that culminated with high tariffs on April 2.
USD diversification: Central banks are an important source of gold demand (Figure 3). We focus more on their motivation, which center on USD diversification and weaponization. Key buyers are emerging market central banks who still have ample room to diversify away from USD toward gold. The largest include China, India, and Turkey, but the scope is broadening into Europe, with Poland the largest buyer in 2024. China began ramping up purchases in 2022, increasing its gold share to 5.5% from 2.0% since 2000, while reducing its USD allocation to 25% from 40%.

Source: World Gold Council, BMO GAM, February 28, 2025.
We see evidence of gold working as an inflation hedge for several reasons. Most importantly, gold adds alpha by outperforming bonds, which are less of a hedge when bond-equity correlations turn positive and deficits surge (Figure 4).

Source: Bloomberg, BMO GAM. Daily cumulative returns since March 15, 2020.
During the 2022 inflation shock, gold outperformed global equities and global bonds by 20 and 16 percentage points, respectively. Real returns, though negative in USD terms, were positive when priced in other currencies like CAD. Gold-bond correlations, which unsurprisingly dislocated after real yields turned positive, tend to fall when yields rise and even diminish when real yields are always positive, such as prior to 2008 (Figure 5).

Source: Bloomberg, BMO GAM. Monthly data, 1973-2007.
We see three reasons why cross asset correlations don’t tell the full story when it comes to gold returns. First, gold returns are positive on sharply negative moves in bonds and in equities, acting as a defensive hedge (Figure 6). Second, an uncertainty premium is likely embedded in gold returns. Finally, central bank demand is providing a backstop, observed in daily flow data.

Source: Bloomberg, BMO GAM. Monthly returns since 1973.
We believe gold is well suited for sticky inflation by outperforming bonds in particular, adding alpha to multi-asset portfolios. Historical inflation-adjusted returns demonstrate its store of value (Figure 7). But arguably the best inflation backdrop for gold is stagflation (a low probability event but where odds are currently rising). The only historical example is the 1970s, and real annualized returns surged.

Source: Bloomberg, BMO GAM. Monthly data since 1973.
We acknowledge gold’s year-to-date returns appear stretched based on its speedy ascent and technical levels relative to 200-day moving averages. But positioning is not crowded or driven by speculative flows. We think the rally reflects several fundamental and strategic drivers that can continue to broaden gold’s investor base.
Stagflation: The U.S. average tariff rate has increased to +20%, which points to a 1.5-2% boost to core inflation and at least a 0.5% hit to growth. Short-term inflation breakevens have room to move higher, and growth forecasts, lower. If significant reflation does materialize, gold is likely to perform better than in 2022 because real yields have already repriced.
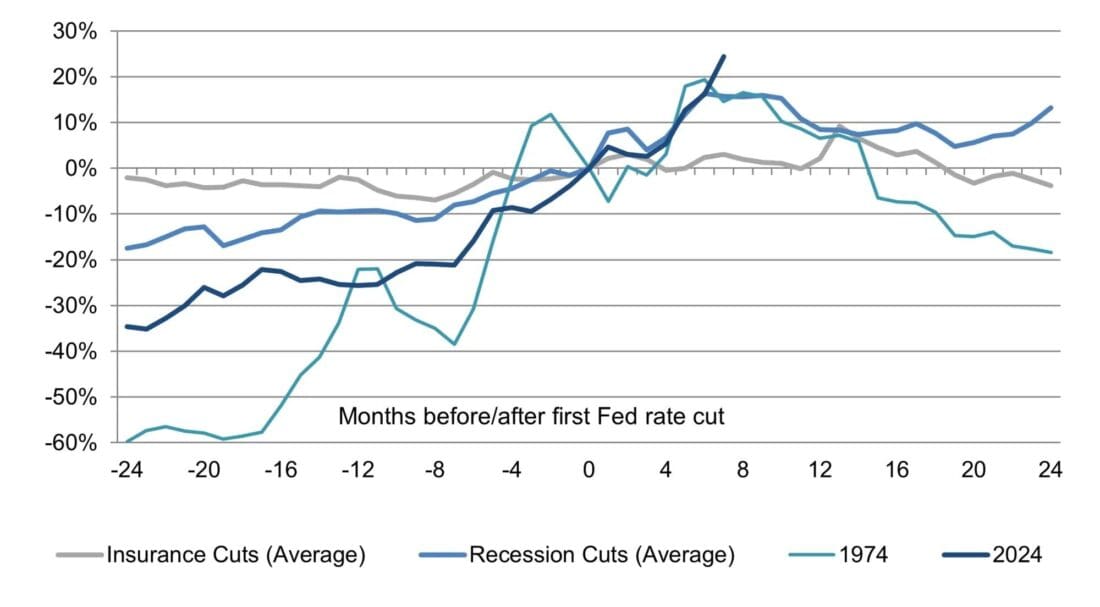
Recession: Gold sees higher returns around recessions, when Fed rate cuts are deeper than insurance cut cycles and uncertainty is higher. Recession odds have risen and could move higher. We find gold’s price action more closely resembles not only recession cuts but also 1973-74 recession, which ended in sticky inflation (Figure 8).

Source: Bloomberg, BMO GAM, as of September 2024
Deficits: Budget deficits increase during recessions because of automatic stabilizers (e.g., unemployment insurance), stimulus and lower revenue receipts. Budget deficits are already high and projected to remain at 6-7% through 2034 without stabilizers, leaving federal debt on a higher trajectory toward 120% of GDP. Should a recession materialize, deficits would widen further—on average by 4 percentage points. A more unsustainable U.S. debt trajectory raises the odds of debt spiral as investors shun Treasuries, driving up interest costs further. Gold would be one of the few safe havens and is correlated to deficit surprises (Figure 9).
USD weakness and end of U.S. exceptionalism: Gold has a strong negative correlation to the U.S. dollar, which peaked in January as U.S. growth projections started declining. We think the Trump administration’s policies are USD-negative (see Make International Great Again), which benefits gold. Tariffs, which reduce trade and therefore demand for USD, threatens USD’s reserve status, underpinning central bank demand as well as private flows which have picked up meaningfully and where the market continues to expand.

Source: Bloomberg, BMO GAM. Annual data since 2008 to 2024.
Gold addresses key investment pillars as a diversifier, store of value, defensive and inflation hedge. The current tailwinds for gold center on rising risks of stagflation, recession and U.S. underperformance, which in turn raise the odds of a more unsustainable U.S. debt trajectory (Figure 10). These themes can drive secular demand as investors look to hedge USD and fixed income exposures.

Source: Bloomberg, BMO GAM, March 2025.
Gold is best positioned to outperform fixed income if tariffs stay elevated and higher inflation limits the extent of rate cuts. Gold can also outperform in a technical recession, which we believe is more likely than a full-blown recession. In the less likely scenario of resilient growth, gold could outperform as reflation concerns remerge.
We view gold as a recession hedge in this cycle. Indeed, bonds are usually the cleanest hedge as the Fed cuts aggressively. However, as the current growth shock embodies an inflation shock and high deficits, bonds are less attractive given risks around Fed policy and government issuance.
Where may gold underperform? The most immediate catalyst is a Trump policy pivot or swift trade deals that lower tariffs significantly. But scenarios where inflation fears diminish or U.S. budget deficits decline are the trends to watch. Goldilocks scenarios where inflation drifts back to 2% amid sustained economic growth could drive a period of underperformance.
We summarize these scenarios in Table 1.

Source: BMO GAM, 2025.
—
Originally Posted May 6, 2025 – What Drives Gold, and Why Should Investors Own It?
Portfolio implications:
We initiated gold allocations to our portfolios in 2020. As of April 2025, we continue to hold allocations averaging 2.5% across our flagship managed solutions and have hedged the recent runup with options.
Disclaimers
The viewpoints expressed by the author represents their assessment of the markets at the time of publication. Those views are subject to change without notice at any time without any kind of notice. The information provided herein does not constitute a solicitation of an offer to buy, or an offer to sell securities nor should the information be relied upon as investment advice. Past performance is no guarantee of future results. This communication is intended for informational purposes only.
Any statement that necessarily depends on future events may be a forward-looking statement. Forward-looking statements are not guarantees of performance. They involve risks, uncertainties and assumptions. Although such statements are based on assumptions that are believed to be reasonable, there can be no assurance that actual results will not differ materially from expectations. Investors are cautioned not to rely unduly on any forward-looking statements. In connection with any forward-looking statements, investors should carefully consider the areas of risk described in the most recent simplified prospectus.
This article is for information purposes. The information contained herein is not, and should not be construed as, investment, tax or legal advice to any party. Particular Investments and/or trading strategies should be evaluated relative to the individual’s investment objectives and professional advice should be obtained with respect to any circumstance.
This article may contain links to other sites that BMO Global Asset Management does not own or operate. Also, links to sites that BMO Global Asset Management owns or operates may be featured on third party websites on which we advertise, or in instances that we have not endorsed. Links to other websites or references to products, services or publications other than those of BMO Global Asset Management on this article do not imply the endorsement or approval of such websites, products, services or publication by BMO Global Asset Management. We do not manage, and we are not responsible for, the digital marketing and cookie practices of third parties. The linked websites have separate and independent privacy statements, notices and terms of use, which we recommend you read carefully.
Any content from or links to a third-party website are not reviewed or endorsed by us. You use any external websites or third-party content at your own risk. Accordingly, we disclaim any responsibility for them.
Commissions, management fees and expenses (if applicable) all may be associated with investments in mutual funds. Trailing commissions may be associated with investments in certain series of securities of mutual funds. Please read the fund facts, ETF facts or prospectus of the relevant mutual fund before investing. Mutual funds are not guaranteed, their values change frequently and past performance may not be repeated. Distributions are not guaranteed and are subject to change and/or elimination.
For a summary of the risks of an investment in the BMO Mutual Funds, please see the specific risks set out in the prospectus. ETF Series of the BMO Mutual Funds trade like stocks, fluctuate in market value and may trade at a discount to their net asset value, which may increase the risk of loss. Distributions are not guaranteed and are subject to change and/or elimination.
BMO Mutual Funds are managed by BMO Investments Inc., which is an investment fund manager and a separate legal entity from Bank of Montreal.
BMO Global Asset Management is a brand name under which BMO Asset Management Inc. and BMO Investments Inc. operate.
“BMO (M-bar roundel symbol)” is a registered trademark of Bank of Montreal, used under licence.
Commissions, management fees and expenses all may be associated with investments in exchange traded funds. Please read the ETF Facts or prospectus of the BMO ETFs before investing. Exchange traded funds are not guaranteed, their values change frequently and past performance may not be repeated.
For a summary of the risks of an investment in the BMO ETFs, please see the specific risks set out in the BMO ETF’s prospectus. BMO ETFs trade like stocks, fluctuate in market value and may trade at a discount to their net asset value, which may increase the risk of loss. Distributions are not guaranteed and are subject to change and/or elimination.
BMO ETFs are managed by BMO Asset Management Inc., which is an investment fund manager and a portfolio manager, and a separate legal entity from Bank of Montreal.
®/™Registered trade-marks/trade-mark of Bank of Montreal, used under licence.
Information posted on IBKR Campus that is provided by third-parties does NOT constitute a recommendation that you should contract for the services of that third party. Third-party participants who contribute to IBKR Campus are independent of Interactive Brokers and Interactive Brokers does not make any representations or warranties concerning the services offered, their past or future performance, or the accuracy of the information provided by the third party. Past performance is no guarantee of future results.
This material is from BMO Exchange Traded Funds and is being posted with its permission. The views expressed in this material are solely those of the author and/or BMO Exchange Traded Funds and Interactive Brokers is not endorsing or recommending any investment or trading discussed in the material. This material is not and should not be construed as an offer to buy or sell any security. It should not be construed as research or investment advice or a recommendation to buy, sell or hold any security or commodity. This material does not and is not intended to take into account the particular financial conditions, investment objectives or requirements of individual customers. Before acting on this material, you should consider whether it is suitable for your particular circumstances and, as necessary, seek professional advice.
Futures are not suitable for all investors. The amount you may lose may be greater than your initial investment. Before trading futures, please read the CFTC Risk Disclosure. A copy and additional information are available at ibkr.com.
There is a substantial risk of loss in foreign exchange trading. The settlement date of foreign exchange trades can vary due to time zone differences and bank holidays. When trading across foreign exchange markets, this may necessitate borrowing funds to settle foreign exchange trades. The interest rate on borrowed funds must be considered when computing the cost of trades across multiple markets.
U.S. Spot Gold trading through IB LLC accounts is only available to legal residents of the United States that do not reside in Arizona, Montana, New Hampshire, and Rhode Island.
Spot currencies are not available at IBKR Singapore.
Related Articles


Join The Conversation
For specific platform feedback and suggestions, please submit it directly to our team using these instructions.
If you have an account-specific question or concern, please reach out to Client Services.
We encourage you to look through our FAQs before posting. Your question may already be covered!