
- Solve real problems with our hands-on interface
- Progress from basic puts and calls to advanced strategies
Interactive Options Course

Posted January 28, 2026 at 1:16 pm
Do they still make hats with round-numbered market milestones? I know that I don’t have an S&P 500 (SPX) 7,000 cap – otherwise I’d be putting it on right now. Frankly, I’m surprised it took this long – I thought that the first attempt would occur during a low-volume “Santa Claus” rally – but it became all but inevitable once we closed a hair’s breadth away yesterday. Since the opening flourish, we’ve seen the target become a bit of resistance. That is understandable ahead of a series of potentially market-moving corporate earnings after the close, coming on the heels of an FOMC meeting.
Yesterday’s piece highlighted the relatively muted expectations embedded in SPX index options. Today we will see what options markets have in mind for Meta Platforms (META), Microsoft (MSFT), and Tesla (TSLA), which are all scheduled to report after the close today, just an hour or so after Chair Powell wraps up his press conference. The screenshots below were taken around 10 AM ET today, so bear in mind that it is possible that the options pricing might have moved by the time you read this. Also, remember our ongoing contention that beating EPS consensus estimates is a necessary, but not sufficient, condition for a post-earnings rally. Guidance matters more.
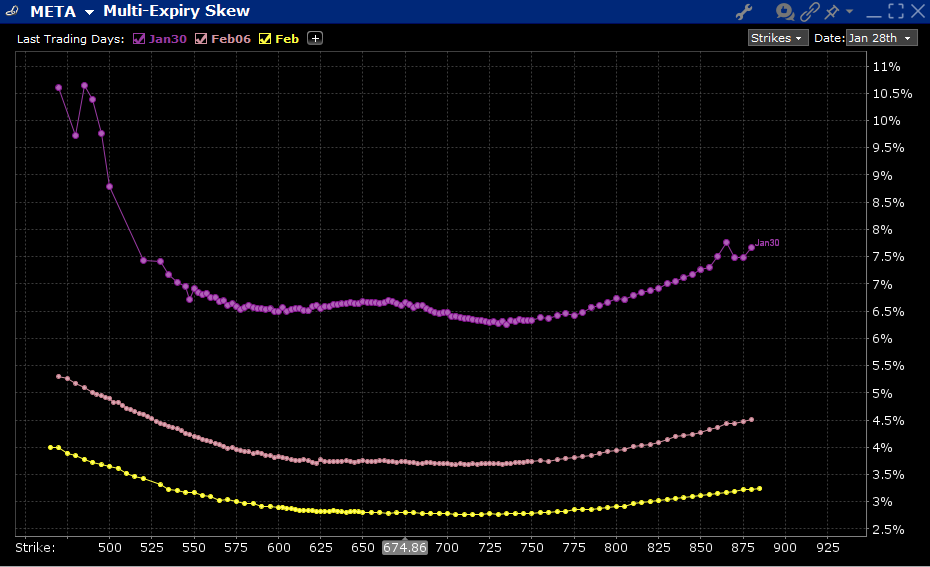
META is the first of the triad alphabetically, so we’ll look at that first. It sports a consensus estimate for Q4 EPS of $8.19 on revenues of $58.41 billion, with projections for Q1 revenues of $51.27 billion, and 2026 capital expenditures of $110.39 billion. The company is quite profitable, but they will need to assuage investor concerns that their immense capital spending will yield sufficient returns. The IBKR Probability Lab shows a relatively flat distribution of peak outcomes. The top of the hump is slightly above current levels, but one can assert that outcomes +/- 4% are priced similarly. Not surprisingly, skews are almost pancake flat from about $550 to $800. At-money weekly options are trading with a roughly 6.7% daily volatility, which is roughly commensurate with the 6.21% average daily move after META’s last six reports (-11.33%, +11.25%, +4.23%, +1.55%, -4.09%, +4.82%).

Source: Interactive Brokers
Source: Interactive Brokers
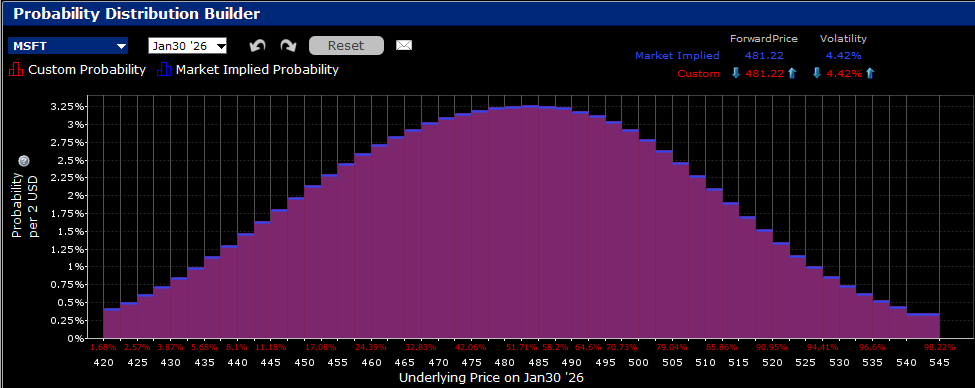
Moving onto MSFT, that behemoth is expected to earn $3.92/share on revenues of $80.3 billion in its Q2, of which $51.24 billion is expected to come from Microsoft Cloud. Azure and other cloud services are expected to show roughly 38% growth in the prior quarter, and capital expenditures are expected to be $25.64 billion for the coming quarter. The probability distribution is relatively symmetrical, with a peak in at-money options. Skews for options around the money are relatively flat, though there is a pronounced bias to above-market, instead of below-market, options. This strikes me as “FOMO insurance” after a relatively lackluster performance by MSFT stock over recent weeks. At-money daily implied volatility for options expiring on Friday are about 5%, above the 4.6% average of the prior six post-earnings moves (-2.92%, +3.95%, +7.63%, -6.18%, -6.05%, -1.08%), but certainly not outrageously so.
Source: Interactive Brokers

Source: Interactive Brokers
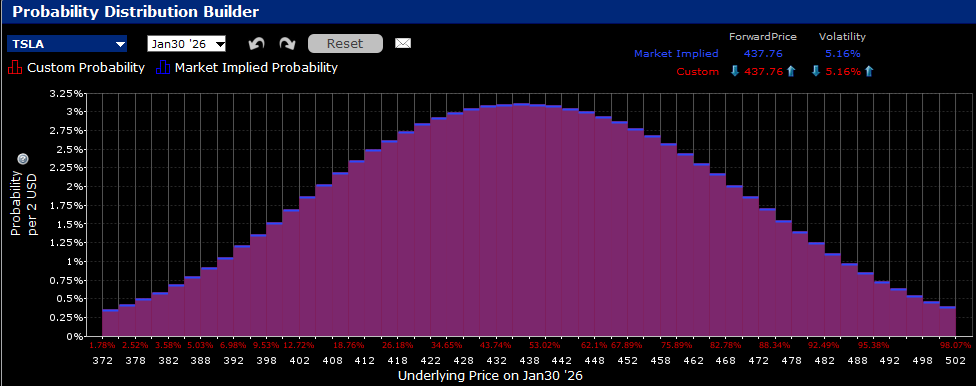
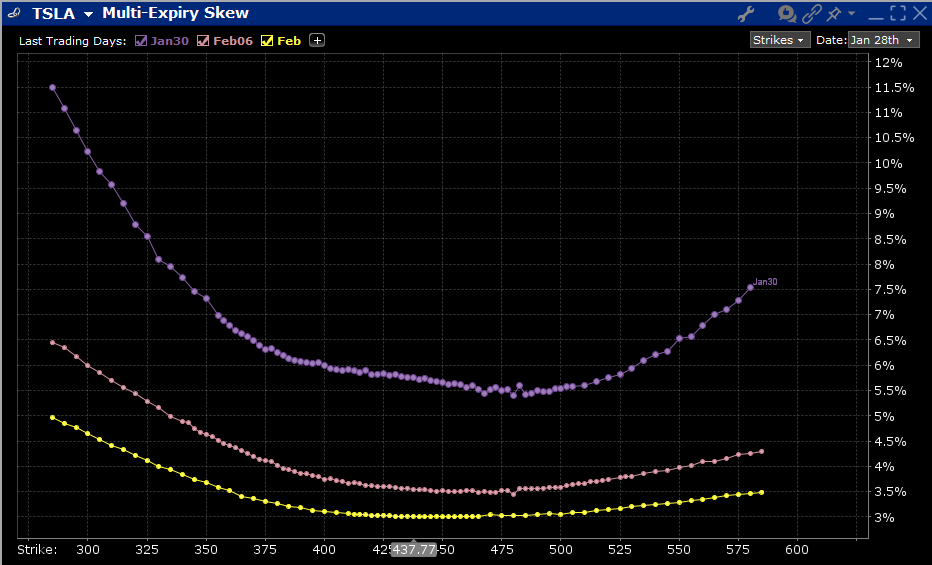
Finally, we have a surprisingly normal set of charts for TSLA – a company that is anything but normal. Numbers matter, with a consensus Q4 EPS estimate of $0.45 on revenues of $24.74 billion, but investors are clearly looking beyond the -38% and -4% one-year drops, respectively, that those estimates imply and instead will be hanging on Elon Musk’s comments about the potential progress on robotaxis, self-driving software, and humanoid robots. Companies with falling earnings don’t typically command P/Es above 300 unless there are huge expectations for future growth beyond their current businesses. Thus, it is interesting to see a symmetrical probability distribution centered around at-money options and a relatively normal “Elvis smile” set of skews. At-money weekly options are pricing in roughly 6% daily volatility, which is a bit below the 8.8% six-quarter average of post-earnings moves (+2.28%, -8.20%, +5.37%, +2.87%, +21.92%, -12.33%), but not out of line with the most recent four.
Source: Interactive Brokers
Source: Interactive Brokers
The analysis in this material is provided for information only and is not and should not be construed as an offer to sell or the solicitation of an offer to buy any security. To the extent that this material discusses general market activity, industry or sector trends or other broad-based economic or political conditions, it should not be construed as research or investment advice. To the extent that it includes references to specific securities, commodities, currencies, or other instruments, those references do not constitute a recommendation by IBKR to buy, sell or hold such investments. This material does not and is not intended to take into account the particular financial conditions, investment objectives or requirements of individual customers. Before acting on this material, you should consider whether it is suitable for your particular circumstances and, as necessary, seek professional advice.
The views and opinions expressed herein are those of the author and do not necessarily reflect the views of Interactive Brokers, its affiliates, or its employees.
Options involve risk and are not suitable for all investors. For information on the uses and risks of options, you can obtain a copy of the Options Clearing Corporation risk disclosure document titled Characteristics and Risks of Standardized Options by going to the following link ibkr.com/occ. Multiple leg strategies, including spreads, will incur multiple transaction costs.
Related Articles


Join The Conversation
For specific platform feedback and suggestions, please submit it directly to our team using these instructions.
If you have an account-specific question or concern, please reach out to Client Services.
We encourage you to look through our FAQs before posting. Your question may already be covered!