
- Solve real problems with our hands-on interface
- Progress from basic puts and calls to advanced strategies
Interactive Options Course

Posted May 1, 2026 at 12:10 pm
This week, we cover Lam Research Corporation and Snap-On, Inc. LRCX’s PRVit rating was upgraded after it reported strong Q1 results last week, reinforcing its position as a top-performing Semiconductor stock driven by accelerated AI demand. SNA’s EVA Momentum picked up after the firm reported strong numbers last week.
The S&P 500 is up around 4% YTD, with 48% of firms in the index having outperformed YTD. EVA Momentum on average is currently 20bps higher for the outperformers, at 1.4%. We conduct 2 stock screens: “The Momentum Screen”; and “Attractive Underperformers with a Positive EVA Margin.”
By adding the EVA Quality (P-R) score together with an attractive dividend yield screen, we think there is an opportunity to add alpha over traditional High Dividend Yield (HDY) investing. We particularly focus on avoiding highly leveraged balance sheets and firms with weak free cash flow generation.
EVA Momentum for the Russell 2000 Growth Index inflected up after slipping in 4Q 2024. Over the last 16 months the EVA Momentum has rebounded to +0.9%. As we have noted, when growth is scarce, buy growth; but even as EVA Momentum has improved, our Profitability Trend (P2) factor has generated 59bps/month of alpha since December 2024.
We use our Value factor to highlight disconnects between the Russell 2000 Value Index and our view of cheap companies. We provide a list of companies that are overweight but score expensive in our Value factor and unattractive in PRVit; a list of the most attractive and cheapest names; and a list of companies that are underweight in the Index, but we regard as cheap attractive PRVit stocks.
Tech has been driving a significant portion of the returns we have seen in the EM Far East universe, but stripping out those companies still yields strong year-to-date performance. We provide attractive, cheap names in the sectors that look the most attractive in the PRVit framework.
EVA Momentum has struggled to turn positive and has further deteriorated in 2026 so far, ending March at -0.9%. EVA Margin dropped close to break-even levels on subdued sales growth negatively impacting EBITDAR Margin and asset efficiency. FGR levels reached 8-year highs in February before improving slightly in March.
Investors remained Risk-On through the last week of the month as our Risk factor posted a negative spread in every region. Profitability worked in the U.K., AxJ, Japan, the Emerging Markets, and the Global region. Quality (which combines Profitability and Risk) worked in EM. Cheap Value outperformed expensive Value in the U.S. and Europe but was off in all other regions. PRVit was negative in all regions.
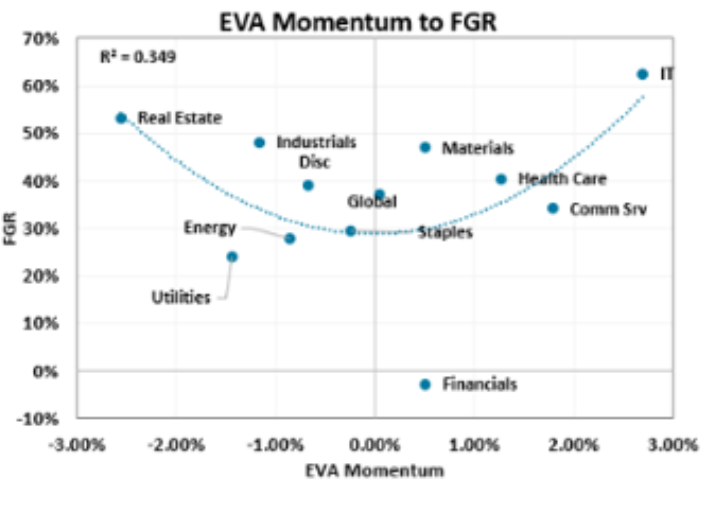
The Chart of the Week plots sector growth (EVA Momentum) versus Valuation (Future Growth Reliance). IT has the highest Valuation as investors pay up for the high level of economic value creation. Communication Services still has high growth but has seen the premium erode through 2026. Industrials has negative EVA Momentum but expectations higher than Materials, a sector with positive EVA Momentum. Financials have the lowest expectations despite positive growth. See our weekly Quant Corner report for additional sector analysis.
—
Originally Posted on April 30, 2026
Information posted on IBKR Campus that is provided by third-parties does NOT constitute a recommendation that you should contract for the services of that third party. Third-party participants who contribute to IBKR Campus are independent of Interactive Brokers and Interactive Brokers does not make any representations or warranties concerning the services offered, their past or future performance, or the accuracy of the information provided by the third party. Past performance is no guarantee of future results.
This material is from ISS EVA and is being posted with its permission. The views expressed in this material are solely those of the author and/or ISS EVA and Interactive Brokers is not endorsing or recommending any investment or trading discussed in the material. This material is not and should not be construed as an offer to buy or sell any security. It should not be construed as research or investment advice or a recommendation to buy, sell or hold any security or commodity. This material does not and is not intended to take into account the particular financial conditions, investment objectives or requirements of individual customers. Before acting on this material, you should consider whether it is suitable for your particular circumstances and, as necessary, seek professional advice.
Related Articles
















Join The Conversation
For specific platform feedback and suggestions, please submit it directly to our team using these instructions.
If you have an account-specific question or concern, please reach out to Client Services.
We encourage you to look through our FAQs before posting. Your question may already be covered!