
- Solve real problems with our hands-on interface
- Progress from basic puts and calls to advanced strategies
Interactive Options Course
Posted May 29, 2026 at 1:00 pm
“Sell in May and go away” is a quaint market adage that we haven’t heard much this month. After a historically stupendous two-month run, even slight advances in key indices can bring us a trifecta of new records, perpetuating the positive momentum and investor sentiment that has driven the S&P 500 (SPX) higher for nine straight weeks. Selling this May – or in fact, many of the recent prior Mays – has not been a winning trade.
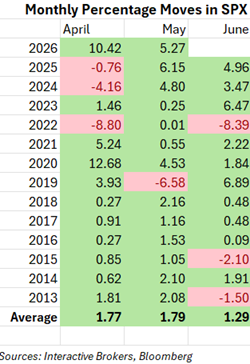
In fact, SPX has experienced only one down May in the last 13 years. Only July and November can make that same claim. The only prior down May in that period was in 2019, when it fell 6.58%. In fact, each of the last two Mays has featured advances of similar magnitudes to this one. Furthermore, each of the prior three Mays, including 2023’s very slight upturn, was followed by substantial gains in June. As the table below shows, only three June swoons have occurred since 2013 as well.
As I prepared to write today’s piece, I searched for other times when I’d used the term “sell in May.” I found a piece entitled “Sell in May and Go Away… But Go Where?” As we wrote at the time:
We’ve all heard the phrase “Sell in May and Go Away.” The adage is cute, but quite incomplete. It doesn’t tell you what to sell and where to go.
Interestingly, that piece was written on May 2, 2022. That was the start of one of the worst Mays in recent history, when the index eked out the smallest of gains – just 0.01%. It also followed an April when SPX fell by 8.8% and preceded an 8.4% drop in June. That was indeed a wonderful May to go away, and I’m pleased to see that our “where to go” was:
Maybe the best place to go is boring old cash. Yes, in an inflationary environment it loses its purchasing power, but it is losing it more slowly than other assets.
We’ll file that under “sometimes even a blind squirrel finds an acorn.” Unfortunately, that offers no guidance about what to expect going forward.
History is not a particularly helpful guide. In a simplistic sense, we can say that it rarely pays to be anything other than long, since SPX has been down in only 7 of the 41 months in the table above, and only 3 of the 13 prior Junes. So, just go long and stay long, right?
The most recent example of an April/May period with returns similar to the current one was in 2020. June 2020 was a solid month too, with a 1.84% gain. Unfortunately, there are huge, concrete differences between then and now. Remember, that was the immediate aftermath of the Covid-induced bear market, and that period featured a dual salvo of massive monetary and fiscal stimuli in response to the crisis. This two-month stretch featured a change to a rate hiking regime from one that anticipated rate cuts, though it has also featured sharp bumps in reported and anticipated earnings in a wide range of companies, primarily those that benefit from AI-related largesse.
We found two other examples this century with similar setups. In 2009, SPX rose 9.39% in April and 5.31% in May. That led to a mere 0.02% rise in June. Remember that this was occurring at the end of the Global Financial Crisis. Stocks bottomed in March after a bout of then-huge stimuli put a stop to a massive two-year bear market. In 2003, SPX rose 8.1% and 5.9% in April and May, respectively, which led to a 1.13% gain in June. Remember that the 2001-02 period also featured a bear market, and that recovery began in March of that year.
As a result, we can’t find a recent example of such a solid April-May period that did not result from measures that were designed to stem a prior bear market. The last prior example was in 1997, when we saw April, May, and June gains of 5.84%, 5.86%, and 4.35% respectively, and those continued into July and beyond. There are certainly plenty of current comparisons to the internet bubble era, but we need to consider whether one from that period’s start is relevant in a bull market that is over 3.5 years old. By the way, SPX had 7.68% and 0.51% rallies in April and May of 2000, though the prior two and subsequent four months were disastrous.
New to Interactive Brokers?
Open AccountAlready an Interactive Brokers Client?
Request Trading PermissionThe analysis in this material is provided for information only and is not and should not be construed as an offer to sell or the solicitation of an offer to buy any security. To the extent that this material discusses general market activity, industry or sector trends or other broad-based economic or political conditions, it should not be construed as research or investment advice. To the extent that it includes references to specific securities, commodities, currencies, or other instruments, those references do not constitute a recommendation by IBKR to buy, sell or hold such investments. This material does not and is not intended to take into account the particular financial conditions, investment objectives or requirements of individual customers. Before acting on this material, you should consider whether it is suitable for your particular circumstances and, as necessary, seek professional advice.
The views and opinions expressed herein are those of the author and do not necessarily reflect the views of Interactive Brokers, its affiliates, or its employees.
For specific platform feedback and suggestions, please submit it directly to our team using these instructions.
If you have an account-specific question or concern, please reach out to Client Services.
We encourage you to look through our FAQs before posting. Your question may already be covered!
Related Articles

















Go long – stay long is really the only “fool proof” (if one wants to call it that) method of investing, provided one is investing long term. I rarely pay too much attention to trends shorter than 3 months (aside from price action resulting from earnings reports), but with recent events, I’ve zoomed in on weekly and even daily charts. Usually too much attention to the short term, can have one missing the forest for a few specific trees. Vacillating on Iran news can drive one to zoom in too much. I expect a sell the news attitude could happen, but if we receive any very solid and definitive news, the market will rally. The “June Swoon” could become a June rally like we’ve not seen in recent history. This latest news of a 60 day “wait and see” period is nothing more than market uncertainty; and we all know how the market feels about uncertainty.
The end of U.S. involvement in the Vietnam War was a similar historical moment. Everyone knew it would happen, the question was just when. As the settlement was teased, stocks set records. Then there was a big sell the news move down. I expect the same here unless the resolution is way above expectations.
> This latest news of a 60 day “wait and see” period is nothing more than market uncertainty; and we all know how the market feels about uncertainty. In a normal market the prospect of a worldwide energy crunch would lead to some noticeable pullback, but this isn’t a normal market — it just shrugs off uncertainty. Looks frothy to me in the short term, but 3 months isn’t likely to break a megabull that I consider to be 17 years, 2 months old for a dedicated long-term investor.
Jeffrey Hirsch’s “Stock Trader’s Almanac” adds a standard MACD filter on “sell in May.” Rather than an automatic sale on May 1, the system calls for holding as long as MACD is positive and selling the open after MACD turns negative. More important, that’s one half of the “Best 6 Months” strategy, which tells you when to get back in, using November 1 and the same MACD filter in reverse. That strategy would have kept you in to get at least a portion of gains in Mays after a positive end to April. For 1950-2017, the returns on Best 6 Months absolutely crushed buy and hold using the ridiculous but still useful DJIA. I don’t know about later years.