
- Solve real problems with our hands-on interface
- Progress from basic puts and calls to advanced strategies
Interactive Options Course

Posted June 12, 2026 at 1:08 pm
Enthusiasm about all things tech and AI has equities extending their recovery from yesterday with the major benchmarks, sectors and subcategories participating in the gains. Sinking oil prices are also supporting the revival in animal spirits, as WTI has fallen to its cheapest level since mid-April on optimism tied to a potential US-Iran peace deal. The associated relief at the pump, meanwhile, drove an upside beat on UMich’s consumer sentiment figure, with the indicator improving for the first time going back to February and raising household spending prospects while strengthening the overall economic outlook. Additionally, the better-than-expected data are bolstering cyclical stocks as the small-cap Russell 2000 gauge soars to a fresh record. It’s up over 1% and is leading the rally from a benchmark perspective alongside the Dow Jones Industrial Average. Elsewhere, yields are slightly higher, the greenback is nearly flat, non-energy commodities and cryptocurrencies are climbing, hedges are being tossed out the window in light of offensive attitudes on Wall Street and prediction markets are catching bids.
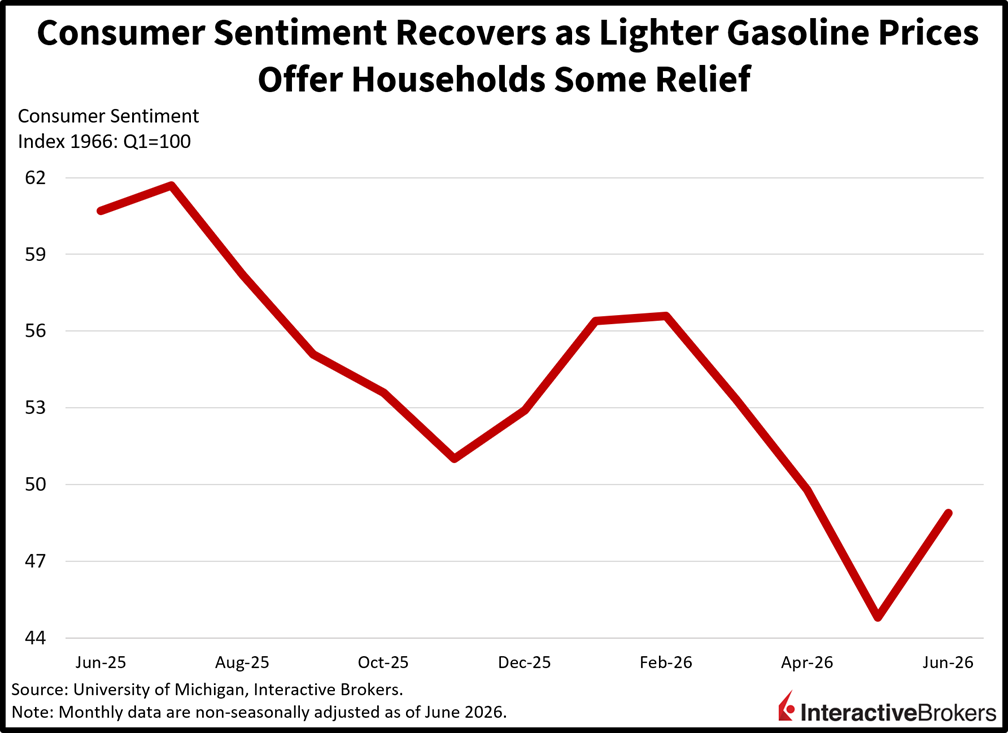
Shoppers expressed a collective sigh of relief this month with lower gasoline prices serving to push the preliminary University of Michigan (UMich) Consumer Sentiment Index up 4.1 points to 48.9, which exceeded the median estimate of 46 by a hefty margin. It also lifted the gauge above its record-low May reading. The sub-indices for current conditions and future projections both rose to 48.4 and 49.3 from 45.8 and 44.1, helping deliver the upside beat. Survey respondents reported improvements with personal finances and business opportunities; however, overall opinions are still extremely pessimistic as folks worry that the recent broader escalation in costs could prove sticky. Nonetheless, near-term progress pushed 1- and 5-year inflation expectations from 3.9% and 4.8% to 3.4% and 4.6%. It’s important to note that this indicator is highly sensitive to changes in fuel charges.
The S&P 500 is once again nearing fresh records as equity bulls try to prove that the latest pullback was just a slight retreat rather than a deeper correction. Investors are increasingly confident that appetites for ongoing artificial intelligence capital expenditures will remain strong while a two-month low in oil prices has Wall Street convinced that this week’s 4.2% inflation figure will collapse back into the 3s quickly. Taken together, robust speculative enthusiasms paired with a fed funds curve that is turning incrementally dovish has put equities in a good position to keep luring buyers. Meanwhile, the path for interest rate cuts in 2027 is carrying a greater likelihood, as favorable base effects from 2026’s elevated crude costs could drive annualized price pressures to a 2-handle return next year.
After a 10 billion yuan contraction in April, new loans in China grew by 520 billion yuan in May, as the result exceeded the economist consensus estimate for the volume to increase by 450 billion yuan. Total outstanding loans were up 5.5% year over year (y/y), matching the economist consensus estimate but the pace decelerated from 5.6% in April. The sluggish loan data has resulted primarily from weak consumer demand for both discretionary items and mortgages with the country experiencing a glut of housing that has been causing a decline in property values.
Manufacturers’ first-quarter gate prices jumped 17.7% y/y in Hong Kong, according to a preliminary version of the Producer Price Index. The y/y price pressure was spread across manufacturing sectors with the single metal, computer, electronic and optical products, machinery and equipment group having the largest increase of 32.0%. Other categories that became more expensive and the extent of their y/y price changes were as follows:
Among services, the following categories experienced the stated price increases:
Conversely, prices sank 4.1%, 2.4% and 2.1% for rental of machinery and equipment, warehousing and storage and telecommunications.
The separate sewerage, waste management and remediation activities sector was up 3.8% following the 0.2% ascent in the fourth quarter.
Industrial production in Hong Kong climbed 3.1% y/y during the first quarter, slowing from 5.8% in the last three months of 2025. Output in the metal, computer, electronic and optical products, machinery and equipment classification jumped 6.6% and the food, beverages and tobacco industry expanded production by 2.1%. Production by the textiles and wearing apparel industry and the separate category of paper products, printing, and reproduction of recorded media industry experienced y/y slips of 4.7% and 2.6%.
Japan’s April industrial production was 0.5% higher than in March, but the result missed the economist consensus expectation for a 0.8% ascent. Nevertheless, it was a reversal from the 0.4% drop in March and was up 2% y/y. The growth occurred even as the country’s Production Capacity Index slipped by 0.2% m/m and 1% y/y to 94.9. The gauge’s 100 level depicts the long-term capacity utilization average. In related matters, shipments were up 1.3% m/m and 1.8% y/y while inventories were down 0.3% m/m and 5% y/y.
New to Interactive Brokers?
Open AccountInformation posted on IBKR Campus that is provided by third-parties does NOT constitute a recommendation that you should contract for the services of that third party. Third-party participants who contribute to IBKR Campus are independent of Interactive Brokers and Interactive Brokers does not make any representations or warranties concerning the services offered, their past or future performance, or the accuracy of the information provided by the third party. Past performance is no guarantee of future results.
This material is from IBKR Macroeconomics, an affiliate of Interactive Brokers LLC, and is being posted with its permission. The views expressed in this material are solely those of the author and/or IBKR Macroeconomics and Interactive Brokers is not endorsing or recommending any investment or trading discussed in the material. This material is not and should not be construed as an offer to buy or sell any security. It should not be construed as research or investment advice or a recommendation to buy, sell or hold any security or commodity. This material does not and is not intended to take into account the particular financial conditions, investment objectives or requirements of individual customers. Before acting on this material, you should consider whether it is suitable for your particular circumstances and, as necessary, seek professional advice.
Futures, event contracts, and forecast contracts are not suitable for all investors. Before trading these products, please read the CFTC Risk Disclosure. For a copy, visit our Warnings and Disclosures Page.
Trading in digital assets, including cryptocurrencies, is especially risky and is only for individuals with a high risk tolerance and the financial ability to sustain losses. Eligibility to trade in digital asset products may vary based on jurisdiction.
Related Articles


Join The Conversation
For specific platform feedback and suggestions, please submit it directly to our team using these instructions.
If you have an account-specific question or concern, please reach out to Client Services.
We encourage you to look through our FAQs before posting. Your question may already be covered!