
- Solve real problems with our hands-on interface
- Progress from basic puts and calls to advanced strategies
Interactive Options Course

Posted July 2, 2026 at 1:28 pm
A weaker-than-anticipated nonfarm payrolls report is subduing Fed hike expectations while sparking a fixed-income rally, as the fourth consecutive month of slower hiring strengthens the case for patience with monetary policy. This morning’s miss signals that there’s risk to employment if the US central bank becomes too restrictive and comes on the heels of Chair Warsh opining yesterday at the ECB forum in Sintra, Portugal, that inflation is too high. The yield curve is plunging in bull-steeping fashion led by the short end, as the lighter-than-projected headline figure of 57k, accompanied by downward revisions to the prior two months, is poised to turn some of the FOMC’s focus back to the unemployment side of its mandate, after several robust statistics in distinct publications had investors fearing that the committee was squarely centered on quelling price pressures. Looser financial conditions, thanks to sinking rates and a depreciating greenback, have helped drive a broad Wall Street advance, with the Dow Jones Industrial Average reaching a fresh record amidst 8 of the 11 sectors in the green, before the other benchmarks reversed from gains to losses. Tech is underperforming on a mix of weakness amongst semiconductors, memory chip producers and 4 of the Magnificent 7, especially Tesla. Elsewhere, cryptocurrencies and non-energy commodities are climbing broadly, both assisted by a softening dollar, while prediction markets are catching bids. Volatility protection instruments are nearly flat following bearish intraday reversals on the Russell 2000, Nasdaq 100 and S&P 500 indices that are keeping hedgers engaged.
Hiring in the US economy slowed for the fourth consecutive month in June, as substantial job losses amounting to 61k in the leisure and hospitality space impeded a triple-digit gain. The headline figure of 57k was below the 110k expected and 129k from May, with just 3 of the 14 sectors recording increases above 10k. Indeed, private education/healthcare, professional/business services and construction saw payrolls grow 69k, 36k and 11k, while manufacturing, wholesale trade, transportation/warehousing, other services and government experienced lighter expansions. Conversely, information, retail, mining and utilities lost less than 10k positions, while financial activities were unchanged.

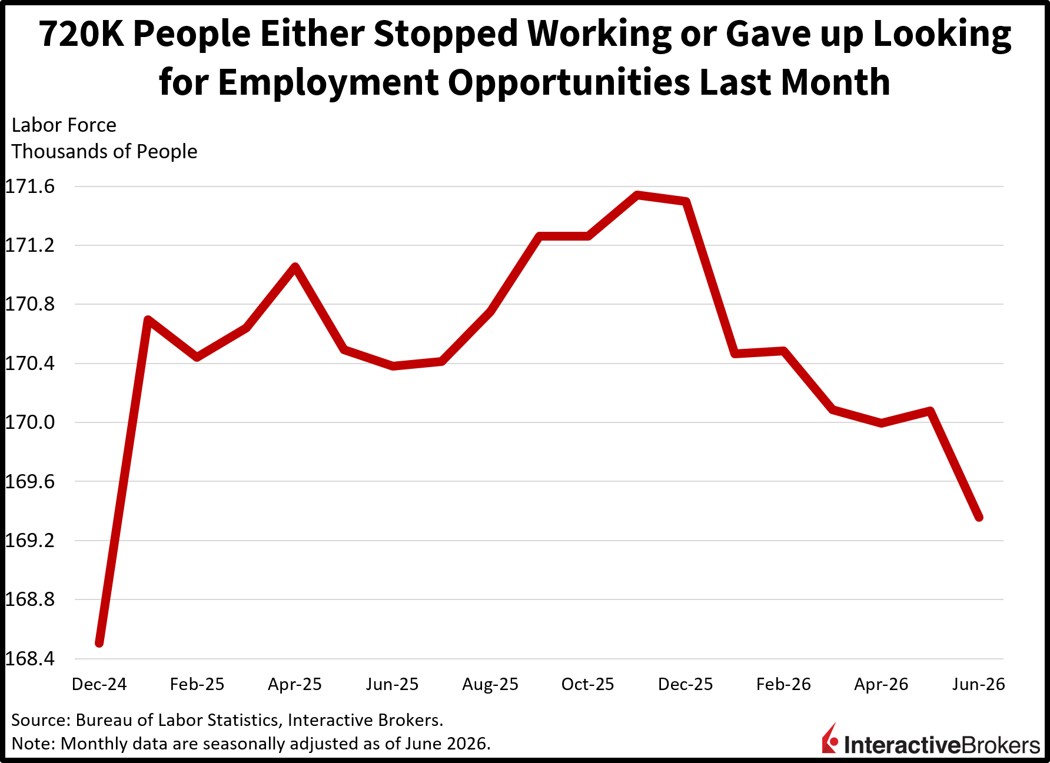
Despite the lackluster headcount additions, the unemployment rate dove to 4.2%, beneath the anticipation for an unchanged 4.3%. But the decline in joblessness was driven by a month-over-month (m/m) labor supply reduction of 720k alongside a 61.5% participation rate, likely a result of immigration restiveness making its way into the data, bringing those two indicators to their lowest levels in 18 and 63 months. Separately, average hourly earnings expanded 0.3% m/m and 3.5% year over year (y/y), coming in in-line with expectations and matching the same pace as May on the former while accelerating slightly from 3.4% on the latter. The average work week remained unchanged at 34.3 hours.

Unemployment claims remained in the safe zone during the past two weeks as subdued employer layoff appetites continued. Initial filings declined to 215k during the interval ended on June 27, beneath the 220k expected and the 216k from the prior period. Continuing applications rose slightly to 1.814 million through the time span culminating on June 20, modestly ahead of the 1.810 million anticipated and the 1.812 million from the previous print. Four-week moving averages shifted in bifurcation fashion from 224.5k and 1.792 million to 222k and 1.803 million.
The ability of the employment market to overcome the headwinds of immigration restrictiveness, AI-adoption and elevated borrowing costs has been remarkable so far this year. Nonetheless, we may have arrived at a critical juncture where worker supply constraints begin to cap payroll gains, as the labor force and its associated participation rate fall to 18- and 63-month lows. Adding further evidence to this challenge is leisure and hospitality businesses posting the most concentrated headcount losses at a time when investors have anticipated buoyant demand for the industry due to the World Cup. This sector is dominated by foreign-born unskilled personnel, and its weakness is emblematic of potential risks ahead, such as wage inflation and a lack of available staff. Those adverse developments could potentially weigh on productivity and economic prospects, however, AI could certainly rise to the occasion and solve a possible scarce labor problem.
Canada’s goods producing sector benefited from increasing output and new orders, which extended its growth for a third-straight month with the S&P Global Canada Manufacturing PMI climbing from 52.9 to 53. The contraction-expansion threshold stands at a score of 50. While various conditions improved, businesses struggled with higher prices of energy, transportation and items from suppliers due to the US-Iran war. Supply chain disruptions associated with the conflict, meanwhile, prompted business to increase their purchases of input items to secure stocks. Higher production demand further intensified supply chain issues. Conversely, survey respondents said new products were supporting sales growth, although tariffs caused export orders to soften. In response to broader demand growth, manufacturers added the largest number of workers since October 2024. Some companies also said they were able to pass tariff costs onto their customers. Companies remained confident that production will continue to grow, in large part due to new products, but worries over US tariffs hurt confidence, which hit a three-month low.
The long reach of artificial intelligence and high energy costs combined with a drop in demand for gold resulted in Australia producing a rare and unexpected goods trade deficit in May. Imports were up 2.6% y/y while exports slipped 6.9% resulting in a negative $3 billion trade balance. Economists anticipated a $2.19 billion surplus after the value of exports exceeded imports by $1.38 billion in April. The value of non-monetary gold shipped abroad plunged 35% m/m in May. Metal ores and minerals, metals and transport equipment shipments, furthermore, sank 4.2%. Elevated prices of energy commodities, meanwhile, caused the value of crude petroleum and diesel shipped to Australia to climb 22.8% and 1.8%, respectively, m/m. By volume, imports of those items dropped 4.5% and 10.6%. Other contributors to import growth included the civil aircraft and confidential items category and telecommunications equipment with m/m jumps of 164% and 35.4%. Australia is a strong exporter of mining products and other natural resources, allowing it to frequently produce trade surpluses. Indeed, May’s trade balance was only the third monthly deficit since January 2018.
The eurozone’s unemployment rate for April was revised downward to a near a record low of 6.2% and remained at that level in May, according to Eurostat. Economists anticipated 6.3%. During May, the number of unemployed individuals fell by 40k.
New to Interactive Brokers?
Open AccountInformation posted on IBKR Campus that is provided by third-parties does NOT constitute a recommendation that you should contract for the services of that third party. Third-party participants who contribute to IBKR Campus are independent of Interactive Brokers and Interactive Brokers does not make any representations or warranties concerning the services offered, their past or future performance, or the accuracy of the information provided by the third party. Past performance is no guarantee of future results.
This material is from IBKR Macroeconomics, an affiliate of Interactive Brokers LLC, and is being posted with its permission. The views expressed in this material are solely those of the author and/or IBKR Macroeconomics and Interactive Brokers is not endorsing or recommending any investment or trading discussed in the material. This material is not and should not be construed as an offer to buy or sell any security. It should not be construed as research or investment advice or a recommendation to buy, sell or hold any security or commodity. This material does not and is not intended to take into account the particular financial conditions, investment objectives or requirements of individual customers. Before acting on this material, you should consider whether it is suitable for your particular circumstances and, as necessary, seek professional advice.
Futures, event contracts, and forecast contracts are not suitable for all investors. Before trading these products, please read the CFTC Risk Disclosure. For a copy, visit our Warnings and Disclosures Page.
Trading in digital assets, including cryptocurrencies, is especially risky and is only for individuals with a high risk tolerance and the financial ability to sustain losses. Eligibility to trade in digital asset products may vary based on jurisdiction.
There is a substantial risk of loss in foreign exchange trading. The settlement date of foreign exchange trades can vary due to time zone differences and bank holidays. When trading across foreign exchange markets, this may necessitate borrowing funds to settle foreign exchange trades. The interest rate on borrowed funds must be considered when computing the cost of trades across multiple markets.
Spot currencies are not available at IBKR Singapore.
Related Articles


Join The Conversation
For specific platform feedback and suggestions, please submit it directly to our team using these instructions.
If you have an account-specific question or concern, please reach out to Client Services.
We encourage you to look through our FAQs before posting. Your question may already be covered!