
- Solve real problems with our hands-on interface
- Progress from basic puts and calls to advanced strategies
Interactive Options Course
Latest Webinars

Posted February 18, 2026 at 12:45 pm
Economic data signaling the continued buoyancy of capital expenditures related to AI is propelling animal spirits on Wall Street today. The positive Durable Goods and Industrial Production prints reflecting ongoing manufacturing activity is quelling concerns of substantial outlays in the space and driving a strong comeback in tech shares, which are leading the market from a sector standpoint. It’s a pretty broad rally, however, with all major categories advancing minus the defensive utilities and health care components. Real estate equities are also retreating in aggregate despite beats on starts and permits this morning, as the factory numbers strengthened optimism about a reacceleration in the cycle. Rising confidence is lifting yields and the greenback as a result, weighing on housing affordability, margins in the industry and costs of construction via heavier mortgage rates. Indeed, lumber is lower on the session as well even as the commodity complex as a whole is largely gaining on safe-haven demand stemming from geopolitical disagreements between Washington and Tehran that could disrupt energy supplies. The mounting tension has sent gold back above its $5,000 level but crypto is barely participating in the action, as Bitcoin and Ethereum gain only modestly. Elsewhere, volatility protection instruments are seeing lessening interest as investors unwind hedges while forecast contracts catch bids.
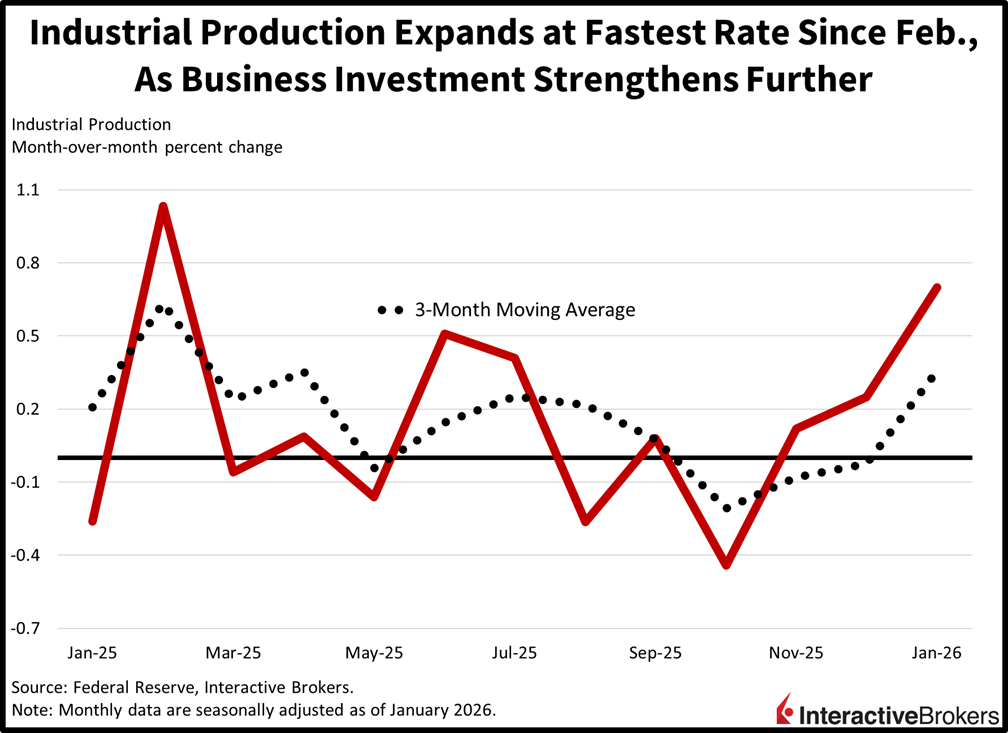
Industrial production grew at its strongest monthly pace since February 2025 to begin the year as capital expenditure incentives from the Big Beautiful Bill are poised to continue bolstering factory activity this year. The 0.7% month-over-month (m/m) increase arrived much stronger than the 0.4% expected and the 0.2% recorded in December. Amongst the major industries, utilities and manufacturing expanded by 2.1% and 0.6% while mining experienced a 0.2% m/m contraction. Across market groups, business equipment, nonindustrial supplies, consumer goods, materials and construction saw output rise 0.9%,0.9%, 0.7%, 0.6% and 0.5% m/m.
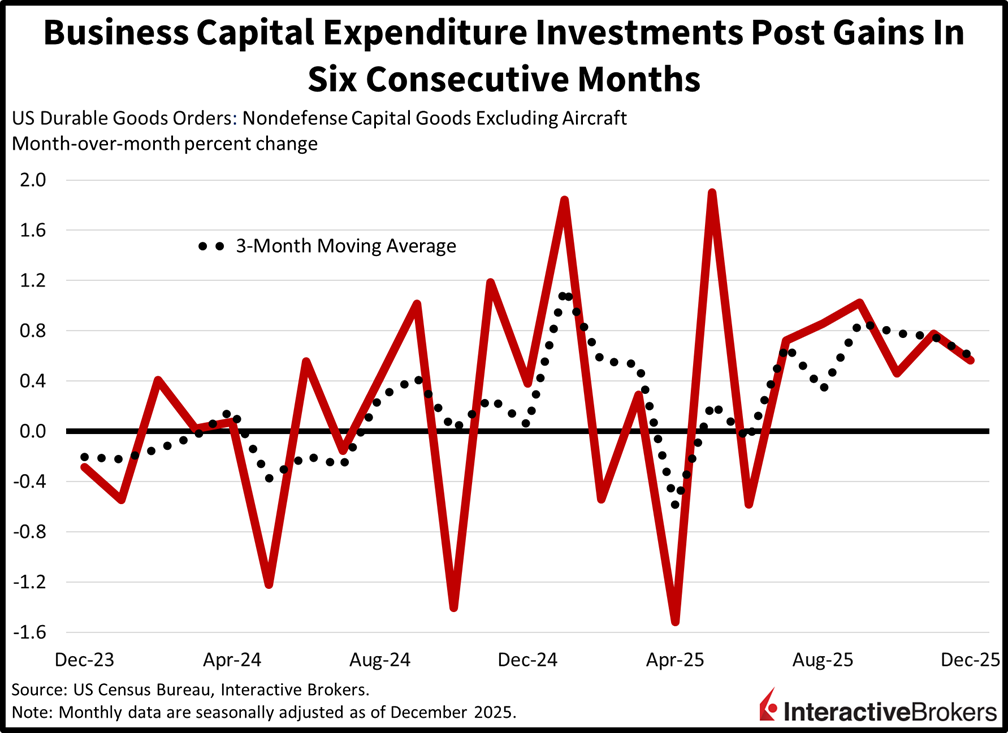
Durable goods orders finished the year strong, but a sharp pullback in the significant and volatile aircraft category generated a top-line contraction even as all the other areas posted increases. December’s -1.4% m/m decline was shallower than the -2% expected and beneath November’s 5.4% gain. The nondefense capital goods section excluding jets, a proxy for business investment, performed strongly nonetheless, expanding 0.6%, its sixth consecutive period of progress, which exceeded the median estimate of 0.4% but decelerated from the prior print’s 0.8%. The computer, primary metal, automobile, fabricated metal product, electrical equipment and machinery segments saw upticks of 3%, 1.7%, 1.2%, 0.9%, 0.6% and 0.3% m/m. In defense, capital goods grew 22.2% while planes expanded 9.5%; however, passenger aircraft slipped 24.9% m/m.
Construction activity recovered to finish off last year as multifamily projects offset the weakness in singles. The pace of housing starts and building permits rose 6.2% and 4.4% m/m to 1.404 million and 1.448 seasonally adjusted annualized units from 1.322 million and 1.411 million, surpassing expectations of 1.33 million and 1.4 million. In both categories, structures with five units or more outperformed single-family, coming in at 10.1% and 18.1% compared to 4.1% and -1.7%. Additionally, all regions posted gains except for the South.

Today’s relief rally follows several sluggish sessions during which investors questioned the impact that AI will have on equity markets. On the one hand, there are concerns of substantial capital expenditures that may fall short of generating adequate returns and on the other, there’s anxiety that the modern technology may disrupt entire industries and occupations. Furthermore, questions about valuations that are in the nosebleeds by historical standards have also caused investor hesitation when approaching stocks this year, with names that fail to impress being punished harshly post quarterly results. Nonetheless, the debate of how much one should pay for a share is an endless one, however, significant drivers of today’s green day in stocks were this morning’s terrific economic numbers. Irrespective of price-to-earnings multiples or a sum of the parts analysis, a reaccelerating cycle bodes well for revenue and profit growth in the aggregate, and that’s a tough force for bears to fight. When adding fiscal stimulus from heavier tax refunds alongside monetary policy accommodation coming this summer, the resulting combination is likely to support this extended run via stronger bids from retail investors and institutions, even as risks linger.
Japan’s January trade deficit was lower than expected due to a surge in exports and weak domestic demand that limited purchases of foreign products, according to provisional data from the Ministry of Finance. During the month, imports exceeded the value of items shipped abroad by 1.1 trillion yen, down 58% from the year-ago period and substantially below the economist consensus estimate of 2.1 trillion yen. The value of items entering the country sank 2.5% year over year (y/y) while exports jumped 16.8%.
Categories with some of the largest increases in export values and the extent of the changes included the following:
Conversely, the TV receiver category and the medical products group were down by 32.9% and 23.6%. Iron and steel products, organic chemicals and ships also weakened with declines of 10.7%, 7.6% and 6.8%.
Among destinations, exports to the US were down 5%, largely in response to import tariffs. Demand from other markets more than offset the decline with shipments to Russia growing 53.4%. China and the overall Asian region, furthermore, increased their imports by 32% and 25.8%. Additionally, purchases by the European Union climbed 29.6%.
The Reuters Tankan poll of Japanese manufacturers’ sentiment rose from plus 7 last month to plus 13 for February, its strongest reading since November. A weakening yen, which can help boost exports, and stronger orders for machinery helped lift the result. Indeed, if December results are any indication of demand this year, manufacturers have reason for optimism. In the final month of 2025, core machinery orders climbed 5.1% m/m and 3.9% y/y after November declines of 11% and 6.4%, according to the Cabinet Office.
The UK Consumer Price Index (CPI) sank 0.5% m/m last month, matching the economist consensus estimate and reversing from the 0.4% ascent in December. Relative to the year ago period, the January print eased from 3.4% to 3% as anticipated by economists. The CPIH, which includes owner occupiers’ house costs, was slightly hotter, climbing 0.3% m/m and 3.2% y/y.
When excluding items with volatile pricing, the resulting Core CPI was down 0.6% m/m, a slightly slower descent than the 0.7% economist consensus estimate. In December, it depicted items being 0.3% more expensive than during November. On y/y basis, the gauge was up 3.1%, slightly hotter than the forecast for 3% but cooler than December’s 3.2% print.
UK producers’ input costs climbed 0.4% m/m in January, matching the economist consensus estimate but reversing from December’s 0.5% descent. In the same month, however, gate prices were unchanged. Economists anticipated a 0.2% m/m lift following December’s 0.1% decline. Even with the monthly cost increase experienced by producers, input stickers were down 0.2% y/y after moving 0.5% in the opposite direction in December. At the same time, gate prices were up 2.5% from the year-ago period following December’s 3.1% y/y jump.
Wages in Australia during the final three months of last year were 0.8% higher quarter over quarter (q/q), matching the growth rate that occurred during the July through September time frame, according to the country’s Bureau of Statistics. Fourth-quarter wages were also up 3.4% y/y, slightly better than the 3.3% raise received by workers during the preceding period.
Information posted on IBKR Campus that is provided by third-parties does NOT constitute a recommendation that you should contract for the services of that third party. Third-party participants who contribute to IBKR Campus are independent of Interactive Brokers and Interactive Brokers does not make any representations or warranties concerning the services offered, their past or future performance, or the accuracy of the information provided by the third party. Past performance is no guarantee of future results.
This material is from IBKR Macroeconomics, an affiliate of Interactive Brokers LLC, and is being posted with its permission. The views expressed in this material are solely those of the author and/or IBKR Macroeconomics and Interactive Brokers is not endorsing or recommending any investment or trading discussed in the material. This material is not and should not be construed as an offer to buy or sell any security. It should not be construed as research or investment advice or a recommendation to buy, sell or hold any security or commodity. This material does not and is not intended to take into account the particular financial conditions, investment objectives or requirements of individual customers. Before acting on this material, you should consider whether it is suitable for your particular circumstances and, as necessary, seek professional advice.
Investments in certain commodities (precious metals) may be subject to significant price volatility and often involve risks related to market fluctuations, liquidity constraints, geopolitical events, and changes in global economic conditions that could adversely affect their value.
U.S. Spot Gold trading through IB LLC accounts is only available to legal residents of the United States that do not reside in Arizona, Montana, New Hampshire, and Rhode Island.
Trading in digital assets, including cryptocurrencies, is especially risky and is only for individuals with a high risk tolerance and the financial ability to sustain losses. Eligibility to trade in digital asset products may vary based on jurisdiction.
Related Articles


")

Join The Conversation
For specific platform feedback and suggestions, please submit it directly to our team using these instructions.
If you have an account-specific question or concern, please reach out to Client Services.
We encourage you to look through our FAQs before posting. Your question may already be covered!