
- Solve real problems with our hands-on interface
- Progress from basic puts and calls to advanced strategies
Interactive Options Course

Posted June 9, 2026 at 3:30 am
Investopedia is partnering with All Star Charts on this newsletter. The contents of this newsletter are for informational and educational purposes only.
Friday’s selloff was sharp because the rally underneath it was thin.
The S&P 500 fell 2.6% on Friday to close at 7,383.74, its worst day since October and its first losing week after nine straight winners.
The Nasdaq dropped more than 4% as chip stocks went into a violent slide. After two months of grinding to records, that stung — and the reason it stung this much has been building since April.
A small group of big tech and chip names had been carrying the index for weeks. When they cracked on Friday, there wasn’t a deep bench of healthy stocks underneath to soften the blow.
You can measure exactly how thin a rally has gotten, and one chart has been showing it since April 20th.
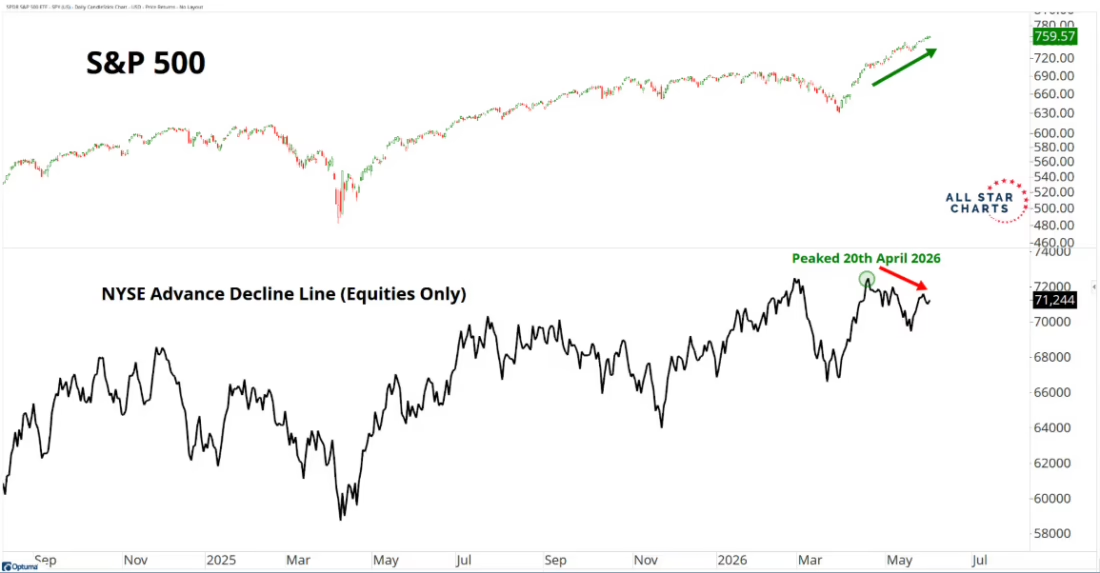
That chart is the NYSE Advance-Decline Line, and it answers a question the index price can’t: how many stocks are actually participating.
The name sounds more complicated than the math. Every day, some stocks rise and some fall.
The Advance-Decline Line keeps a running tally of the difference — advancers minus decliners, added up day after day.
When more stocks rise than fall, the line climbs, and when it rises alongside the index, the rally is broad and a lot of stocks are pulling the same direction. What it tracks is participation, the one thing a record-high price tag can hide.
On April 20th, the A/D Line peaked and started drifting lower. The S&P, meanwhile, pushed another 10% higher to fresh records.
Price climbed while participation faded. That gap is called a negative divergence, and it meant the new highs were being manufactured by a shrinking handful of names while the average stock had already stopped advancing.
Now for the part that matters, because it’s where most people get this wrong. That April signal was not a sell button.
If you’d dumped your positions on April 20th, you’d have missed that entire 10% run to new records, and one rough week doesn’t come close to paying you back for it.
Breadth divergences are lousy timing tools. They can run for months, and plenty of them resolve with stocks catching back up instead of price falling.
What a divergence actually tells you is what kind of market you’re standing in. A narrow rally is a fragile one. It holds up fine right until the few names doing the work stumble, and then the drop comes faster and steeper than the calm surface suggested, because nothing broad is there to catch it.
That’s not a reason to sell the top. It’s a reason to know your footing — to stop chasing the crowded winners with both hands, to keep your risk tighter than the placid index makes you feel, and to not be shocked when a day like Friday finally shows up.
So the question from here isn’t whether the warning was right. It’s what comes next. Either the broad market steadies and more stocks rejoin the move, which would tell you the rally is widening back out and getting sturdier.
Or Friday was the first real crack in a market that had been leaning on too few names for too long. The A/D Line will show you which before the index makes it obvious.
P.S. The useful tells are rarely the loud ones, and they almost never make the headline. Knowing which charts to check each morning is how you read the market’s footing instead of just its scoreboard. The Stock Market TV Daily Rundown lands in your inbox daily with the full lineup — the interviews, the live trading sessions, and the coverage worth catching. Stay informed with the market’s Daily Rundown.
—
Originally posted 8th June 2026
Investopedia.com: The comments, opinions and analyses expressed herein are for informational purposes only and should not be considered individual investment advice or recommendations to invest in any security or to adopt any investment strategy. While we believe the information provided herein is reliable, we do not warrant its accuracy or completeness. The views and strategies described on our content may not be suitable for all investors. Because market and economic conditions are subject to rapid change, all comments, opinions and analyses contained within our content are rendered as of the date of the posting and may change without notice. The material is not intended as a complete analysis of every material fact regarding any country, region, market, industry, investment or strategy. This information is intended for US residents only.
Information posted on IBKR Campus that is provided by third-parties does NOT constitute a recommendation that you should contract for the services of that third party. Third-party participants who contribute to IBKR Campus are independent of Interactive Brokers and Interactive Brokers does not make any representations or warranties concerning the services offered, their past or future performance, or the accuracy of the information provided by the third party. Past performance is no guarantee of future results.
This material is from Investopedia and is being posted with its permission. The views expressed in this material are solely those of the author and/or Investopedia and Interactive Brokers is not endorsing or recommending any investment or trading discussed in the material. This material is not and should not be construed as an offer to buy or sell any security. It should not be construed as research or investment advice or a recommendation to buy, sell or hold any security or commodity. This material does not and is not intended to take into account the particular financial conditions, investment objectives or requirements of individual customers. Before acting on this material, you should consider whether it is suitable for your particular circumstances and, as necessary, seek professional advice.
Related Articles


Join The Conversation
For specific platform feedback and suggestions, please submit it directly to our team using these instructions.
If you have an account-specific question or concern, please reach out to Client Services.
We encourage you to look through our FAQs before posting. Your question may already be covered!