
- Solve real problems with our hands-on interface
- Progress from basic puts and calls to advanced strategies
Interactive Options Course

Posted October 22, 2025 at 1:15 am
Interactive Brokers’ Trader Workstation (TWS) Risk Navigator stands as one of the most sophisticated risk analysis tools available to retail traders, offering institutional-grade capabilities for modeling potential outcomes across complex options positions. Among its most powerful features is the custom scenario functionality, which allows traders to project option prices based on changes in underlying price, implied volatility, and time decay.
While many traders rely on basic option calculators, the Risk Navigator offers a comprehensive analysis environment that simultaneously evaluates multiple positions against customized market scenarios. This multidimensional approach provides a more nuanced understanding of how options and combinations will behave under various market conditions, helping traders make more informed decisions about position management and strategy selection.
The tool’s strength lies in its ability to model complex interactions between multiple variables—underlying price movements, volatility changes, and time decay—which collectively determine option pricing. By manipulating these variables through custom scenarios, traders can stress-test strategies before execution and develop contingency plans for various market developments.
Accessing the Risk Navigator What-If Feature
The process begins with creating a watchlist containing the options or combinations you wish to analyze. To initiate a custom scenario analysis:
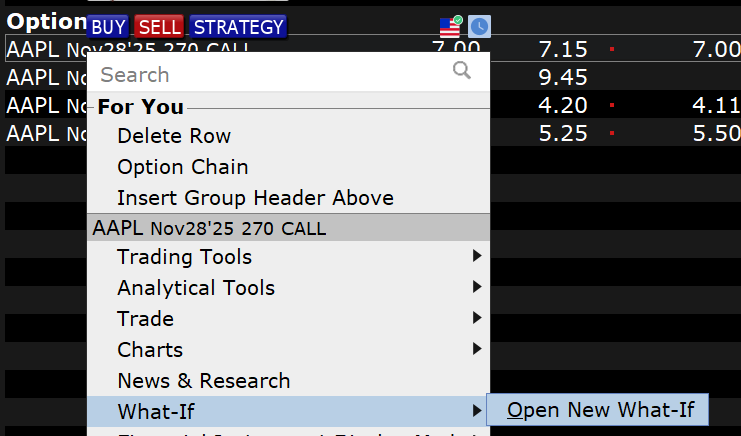
The investor could also open a new “What-if” from the New Window area and type in the option or options once it is up.
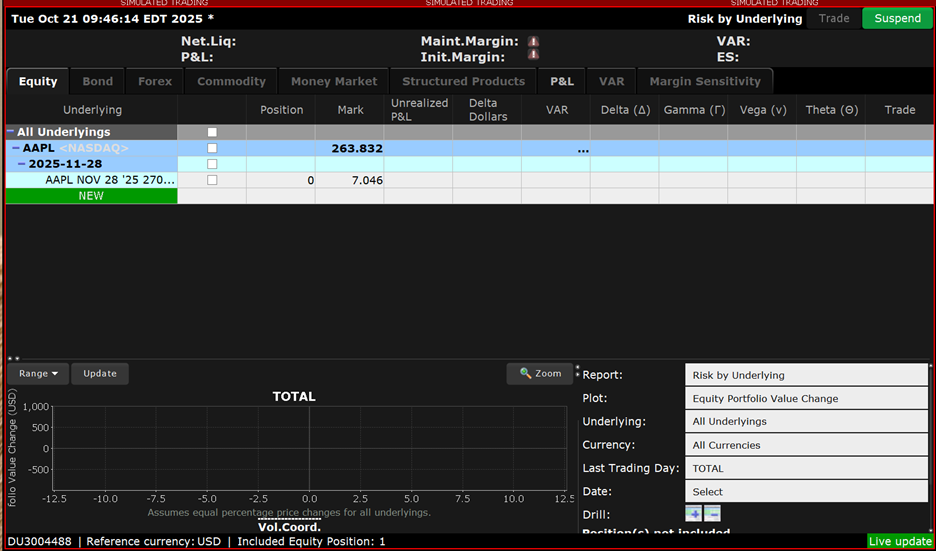
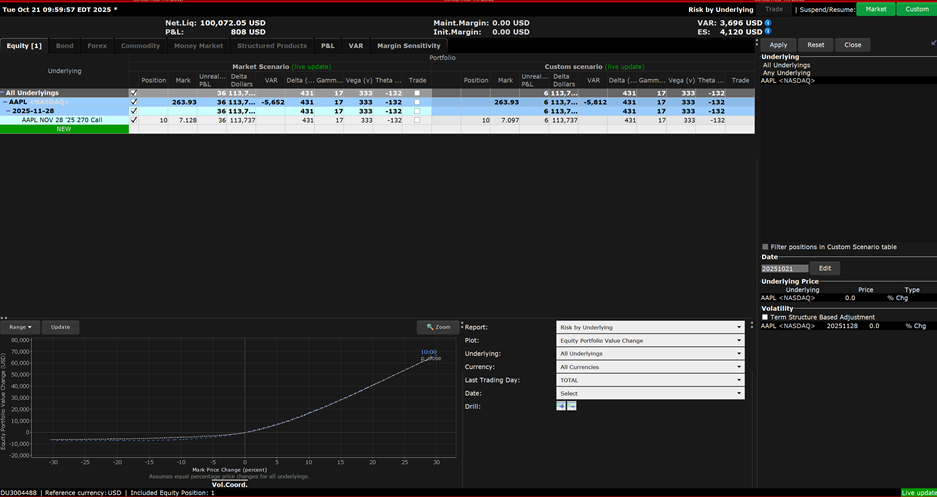
This initial view displays the current market pricing and associated risk metrics for your selected option. To enhance your analysis, additional risk columns should be added through the Metrics Menu. Essential metrics include:
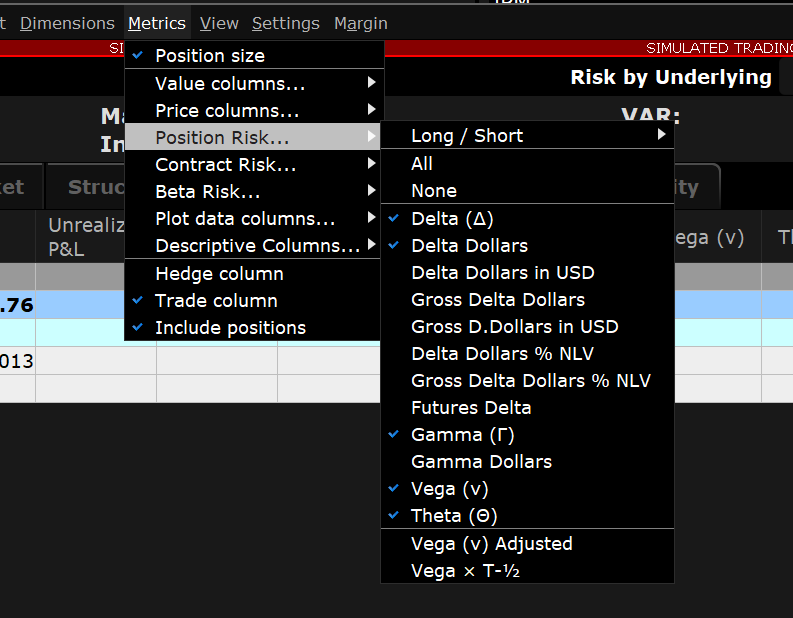
With these metrics displayed, you can now see both current market prices and associated risk values, establishing a baseline for your scenario analysis.
The investor can access the custom scenario feature by clicking on the “View” menu at the top of the Risk Navigator, scrolling down to and selecting “Custom Scenario”. The Custome Scenario feature splits the screen, displaying the current market scenario on the left and a customizable scenario on the right.
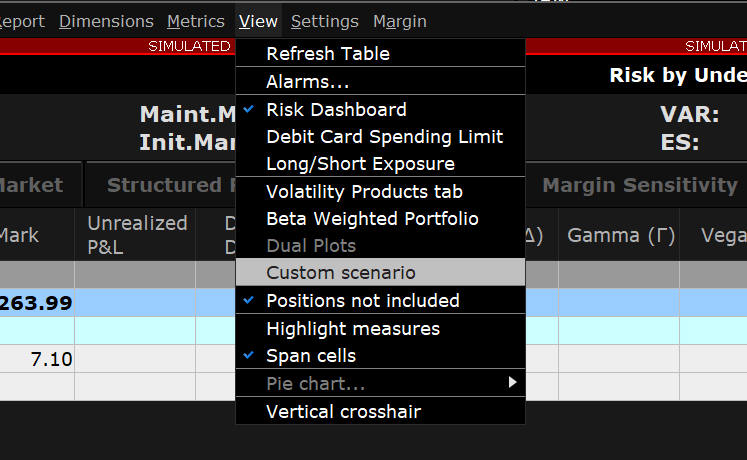
The custom scenario initially replicates the market scenario but can be modified to model different conditions.
The scenario editor allows the investor to adjust three critical variables:
Additionally, you can set a final settlement price to model expiration outcomes. Each adjustment appears in red text until you click “Apply,” at which point the custom scenario recalculates all option values and risk metrics based on your parameters.
Practical Scenario Examples
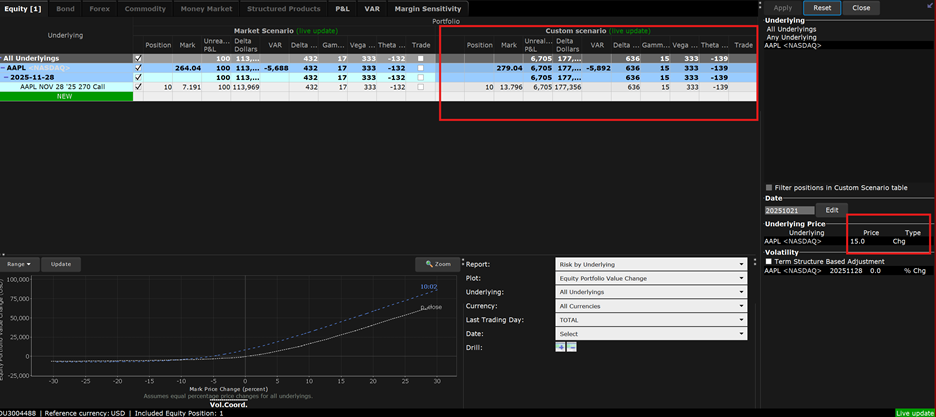
Scenario One: Single Option Analysis: Long Call
Consider a long call position where you want to model two separate scenarios:
For the first scenario, select “chg” from the “Type” dropdown and enter “$15” in the price field. After applying this change, the option’s premium increases substantially, reflecting the call’s positive delta exposure. The risk metrics also adjust, showing higher delta and delta dollars but reduced gamma as the option moves further in-the-money.
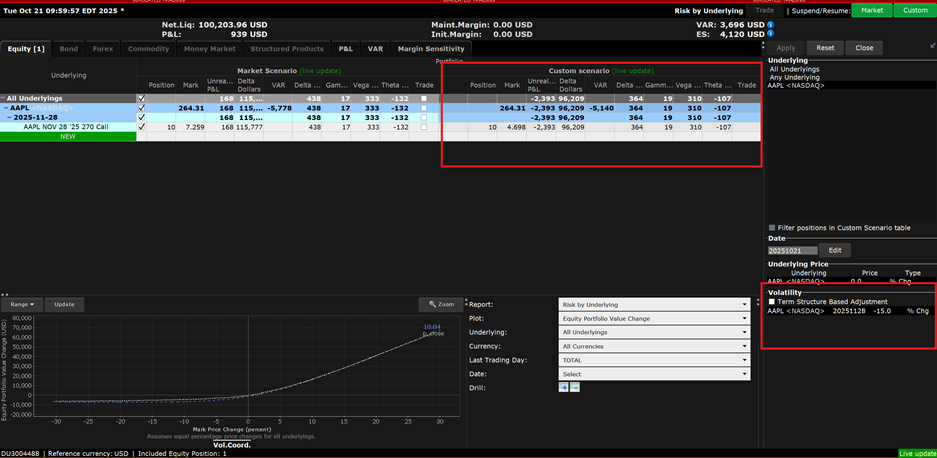
For the second scenario, reset the price change and enter “-15%” in the volatility field. Upon application, the option’s premium decreases, demonstrating the how volatility contractions can undermine long option positions.
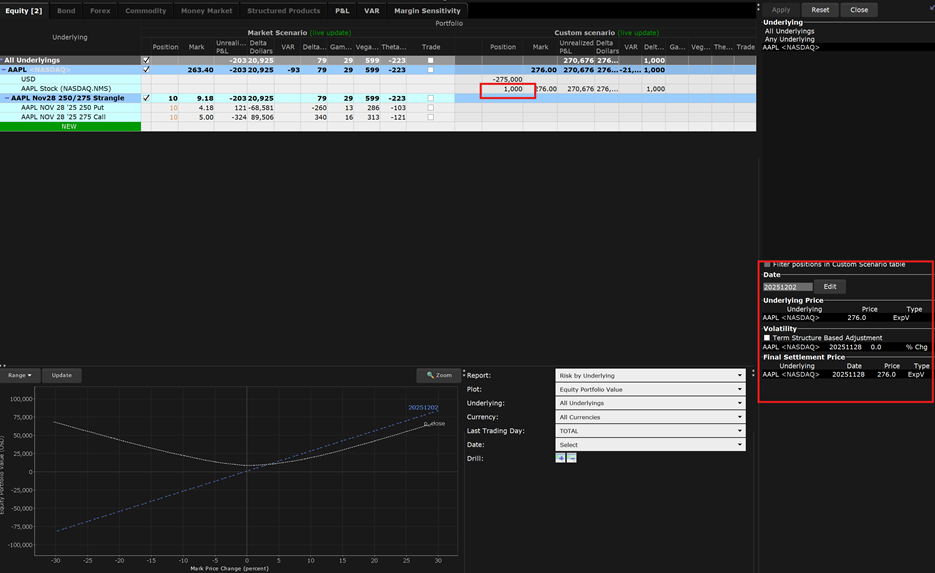
Scenario Two: Complex Strategy Analysis: Strangle Combination
When analyzing multi-leg strategies like strangles, the Risk Navigator’s power becomes even more apparent. A strangle— consisting of a call and put with different strikes in the same expiration—responds asymmetrically to price changes but symmetrically to volatility changes.
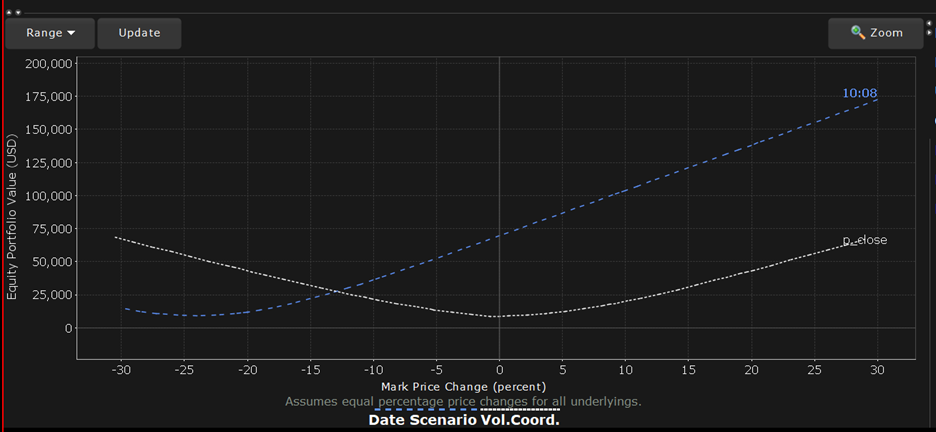
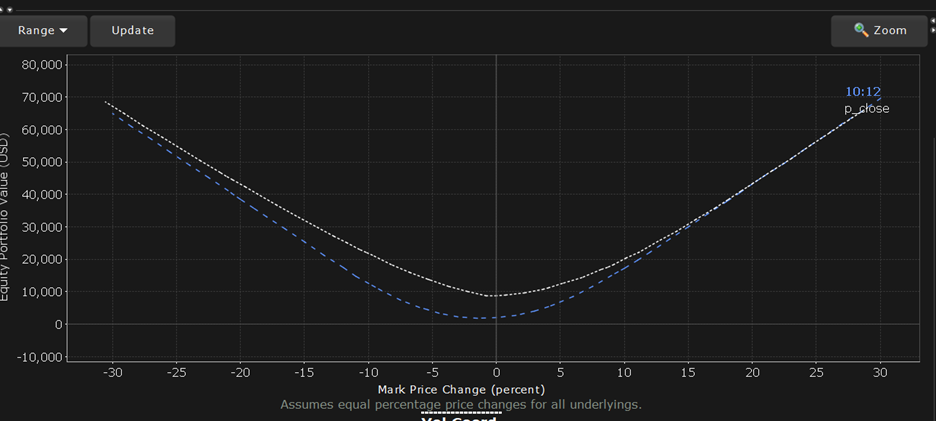
Modeling a 30% price increase reveals how the call’s premium rises substantially while the put’s premium falls, though not proportionally. The net position delta shifts dramatically positively, as visualized in both the data table and the position graph, where the custom scenario (dotted blue line) diverges significantly from the current market scenario (white line).
Alternatively, modeling a 50% volatility decrease shows both options losing significant value, highlighting the strangle’s strong positive Vega exposure. This scenario helps traders understand why strangles typically perform poorly when markets calm after periods of heightened volatility.
Perhaps the Risk Navigator’s most valuable feature is its ability to model positions across time, including beyond expiration. By advancing the date to the day before expiration, traders can visualize the accelerating theta decay that characterizes options in their final days. Out-of-the-money options show particularly dramatic premium erosion, reinforcing the challenges of holding such positions into expiration week.
The tool also allows modeling what happens after expiration by:
For example, modeling a strangle where the underlying price exceeds the call strike at expiration automatically converts the position to 100 shares of stock in the custom scenario, with no remaining option positions. This powerful feature helps traders understand assignment risk and plan for post-expiration portfolio adjustments.
The TWS Risk Navigator’s custom scenario feature represents a significant advancement in options analysis tools available to individual traders. By providing a comprehensive environment to model the complex interactions between price movements, volatility changes, and time decay, it empowers traders to develop more nuanced strategies and manage risk more effectively.
While the learning curve may be steeper than basic options calculators, the insights gained through custom scenario analysis can dramatically improve trading outcomes. Traders seeking to elevate their options strategies should invest time in mastering this powerful tool, using it to test assumptions, validate strategies, and develop a deeper understanding of an option’s behavior across varying market conditions.
As options trading continues to grow in popularity, tools like the Risk Navigator that provide institutional-grade analysis capabilities will increasingly separate successful traders from those relying on more simplistic approaches to options strategy development and risk management.
For more information on the IBKR Risk Navigator tool, please see the Traders’ Academy course.
The analysis in this material is provided for information only and is not and should not be construed as an offer to sell or the solicitation of an offer to buy any security. To the extent that this material discusses general market activity, industry or sector trends or other broad-based economic or political conditions, it should not be construed as research or investment advice. To the extent that it includes references to specific securities, commodities, currencies, or other instruments, those references do not constitute a recommendation by IBKR to buy, sell or hold such investments. This material does not and is not intended to take into account the particular financial conditions, investment objectives or requirements of individual customers. Before acting on this material, you should consider whether it is suitable for your particular circumstances and, as necessary, seek professional advice.
The views and opinions expressed herein are those of the author and do not necessarily reflect the views of Interactive Brokers, its affiliates, or its employees.
Options involve risk and are not suitable for all investors. For information on the uses and risks of options, you can obtain a copy of the Options Clearing Corporation risk disclosure document titled Characteristics and Risks of Standardized Options by going to the following link ibkr.com/occ. Multiple leg strategies, including spreads, will incur multiple transaction costs.
Related Articles


")


Join The Conversation
For specific platform feedback and suggestions, please submit it directly to our team using these instructions.
If you have an account-specific question or concern, please reach out to Client Services.
We encourage you to look through our FAQs before posting. Your question may already be covered!