
- Solve real problems with our hands-on interface
- Progress from basic puts and calls to advanced strategies
Interactive Options Course

Posted September 8, 2023 at 12:30 pm
This morning, I was asked some questions about the relative outperformance of large-cap stocks. Some of the facets of relative performance have been well-documented: that mega-cap tech stocks have led the way, and that cap-weighted indices have vastly outperformed their equal-weighted counterparts. The question, of course, is why, and whether that situation is likely to persist. But first, let’s let a few charts tell the initial story.
Each of the following charts normalize major indices and sub-indexes to the start of the year. First, we have the S&P 500 (SPX) vs. its equal-weighted version (SPW). SPX is up over 16% YTD, while SPW is up just over 4%:
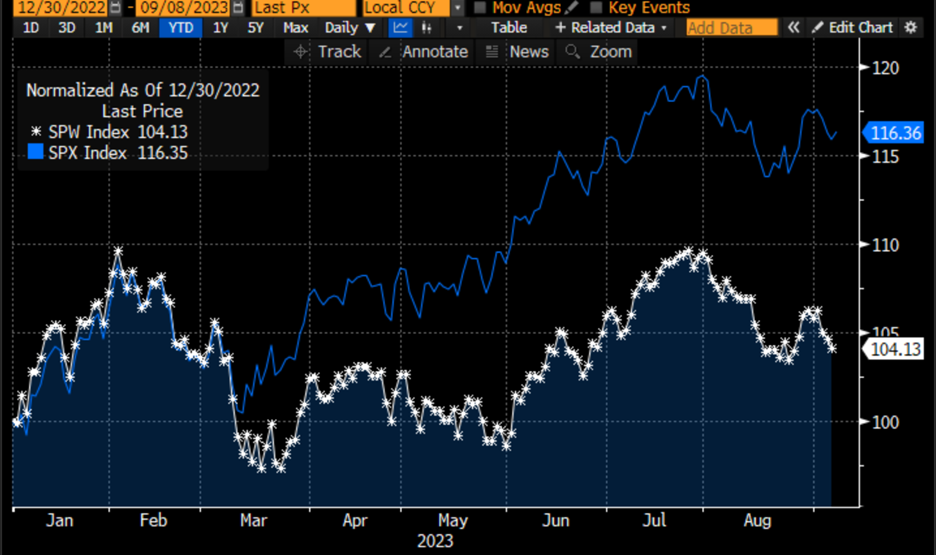
Source: Bloomberg
Next, we have a normalized view of four key US indices: SPX, NASDAQ 100 (NDX), S&P Midcap 400 (MID), and Russell 2000 (RTY). The outperformance of the top-heavy, tech heavy NDX has been well-reported, but the relative stagnation of both MID and RTY has been generally overlooked. NDX is up over 40% so far this year, well above SPX, while MID and RTY languish in the +5-6% range.
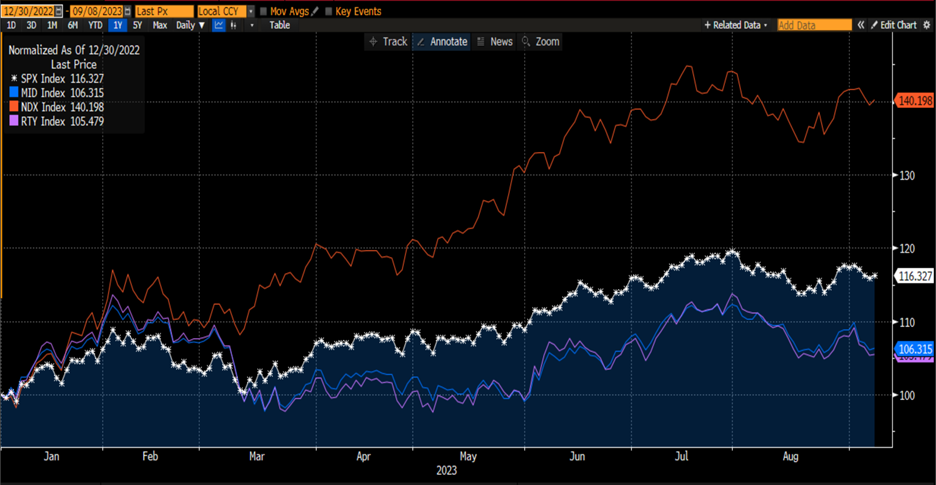
Source: Bloomberg
Finally, a similar (but busy) chart of the 11 sectoral sub-indices of the S&P 500 puts the relative dominance of certain sectors into stark perspective. Information Technology, featuring Microsoft (MSFT) and Nvidia (NVDA), Communications Services, featuring Alphabet (GOOG, GOOGL), Meta Platforms (META) and Netflix (NFLX), and Consumer Discretionary, featuring Amazon (AMZN) and Tesla (TSLA) lead by a wide margin with +30-40% year-to-date gains. Meanwhile the other 8 sectors meander around the unchanged line, with Materials and Energy being the best of the rest, while rate-sensitive sectors like Real Estate and especially Utilities are unsurprisingly down for the year.

Source: Bloomberg
Now that we have seen some vivid displays about the types and amounts of outperformance, let’s circle back to the questions about why this occurred and whether it might persist. I believe that four factors were key:
The results demonstrate a real conundrum for investors. Many fell in love with tech stocks during the low interest rate regime of prior years, when “TINA”, an acronym for “There Is No Alternative”, was a key mantra. Cash, short-term fixed income, and other low-risk alternatives paid nearly nothing. Now it is quite easy for ordinary investors to earn 4-5% interest on these products. Quite frankly, that compares quite well on a risk-adjusted basis to the average stock.
That means that the outperformance of certain stocks and sectors attracts more risk capital to them. If your choices are riding winners higher or adding fresh capital to stocks with cash-like returns, it is understandable why money continues to flow to the leaders.
Can this continue? Sure. It goes back to the inertial market premise, that a market or group of stocks stays in motion until acted upon by an external force. Reversion to the mean is possible, but it would presumably need a catalyst. Could China vs. AAPL be that sort of force? Perhaps. Could it be something more prosaic, like those needing to resume student loan payments selling their favorite stocks to raise cash? Quite possibly. Let’s see how we handle factors like those over the coming weeks.
For specific platform feedback and suggestions, please submit it directly to our team using these instructions.
If you have an account-specific question or concern, please reach out to Client Services.
We encourage you to look through our FAQs before posting. Your question may already be covered!
The analysis in this material is provided for information only and is not and should not be construed as an offer to sell or the solicitation of an offer to buy any security. To the extent that this material discusses general market activity, industry or sector trends or other broad-based economic or political conditions, it should not be construed as research or investment advice. To the extent that it includes references to specific securities, commodities, currencies, or other instruments, those references do not constitute a recommendation by IBKR to buy, sell or hold such investments. This material does not and is not intended to take into account the particular financial conditions, investment objectives or requirements of individual customers. Before acting on this material, you should consider whether it is suitable for your particular circumstances and, as necessary, seek professional advice.
The views and opinions expressed herein are those of the author and do not necessarily reflect the views of Interactive Brokers, its affiliates, or its employees.
Related Articles


")

Good article. Thanks!
Thank you, Pete. We hope you’ll continue to follow Traders’ Insight.