Your Privacy
When you visit any website it may use cookies and web beacons to store or retrieve information on your browser. This information might be about you, your preferences or your device and is typically used to make the website work as expected. The information does not usually directly identify you, but can provide a personalized browsing experience. Because we respect your right to privacy, you can choose not to allow some types of cookies and web beacons. Please click on the different category headings to find out more and change our default settings. However, blocking some types of cookies may impact your experience on our website and limit the services we can offer.
Strictly Necessary Cookies
Strictly necessary cookies are necessary for the website to function and cannot be switched off in our systems. They are typically set in response to actions made by you which amount to a request for services, such as setting your privacy preferences, logging in or filling in forms. While you can set your browser to block or alert you about these cookies, some parts of the website will not work. These cookies do not store any personally identifiable information.
ALWAYS ACTIVE
Functional Cookies
Functional cookies enable our website to provide enhanced functionality and personalization. They may be set by us or by third party providers whose services we have added to our pages. If you do not allow these cookies then some or all of these services may not function properly.
Marketing Cookies and Web Beacons
Marketing Cookies and web beacons may be set through our website by our advertising partners. They may be used by those companies to build a profile of your interests and show you relevant adverts on other websites. They do not directly store personal information, but uniquely identify your browser and internet device. If you do not allow these cookies and web beacons, you will experience less targeted advertising. Our website does not track users when they cross to third party websites, does not provide targeted advertising to them and therefore does not respond to "Do Not Track" signals.
Interactive Brokers Group Cookie Policy
What are Cookies and Web Beacons?
Cookies are pieces of data that a website transfers to a user's hard drive for record-keeping purposes. Web beacons are transparent pixel images that are used in collecting information about website usage, e-mail response and tracking. Generally, cookies may contain information about your Internet Protocol ("IP") addresses, the region or general location where your computer or device is accessing the internet, browser type, operating system and other usage information about the website or your usage of our services, including a history of the pages you view.
How We Use Cookies and Web Beacons
Interactive Brokers Group collects information from cookies and web beacons and stores it in an internal database. This information is retained in accordance with our Privacy Policy. This website uses the following cookies and web beacons:
Strictly Necessary Cookies
These cookies are necessary for the website to function and cannot be switched off in our systems. They are usually only set in response to actions made by you which amount to a request for services, such as setting your privacy preferences, logging in or filling in forms. You can configure your browser to block or alert you about these cookies, but certain areas of the site will not function properly. These cookies do not store any personal data.
Performance Cookies and Web Beacons
These cookies and web beacons allow us to count visits and traffic sources so we can measure and improve the performance of our site. They help us to know which pages are the most and least popular and see how visitors move around the site. All information that these cookies and web beacons collect is aggregated and, therefore, anonymous. If you do not allow these cookies and web beacons our aggregated statistics will not have a record of your visit.
The website uses Google Analytics, a web analytics service provided by Google, Inc. ("Google"). Google Analytics uses cookies to help analyse how you use this website. The information generated by the cookie about your use of this website (including your IP address) will be transmitted to and stored by Google on servers in the United States. Google will use this information for the purposes of evaluating your use of the website, compiling reports on website activity for website operators and providing other services relating to website activity and internet usage. Google may also transfer this information to third parties where required to do so by law, or where such third parties process the information on Google's behalf. Google will not associate your IP address with any other data held by Google.
Functional Cookies
These cookies enable the website to provide enhanced functionality and personalization. They may be set by us or by third party providers whose services we have added to our pages. If you do not allow these cookies, some or all of these services may not function properly.
Marketing Cookies and Web Beacons
These cookies and web beacons may be set throughout our site by our advertising partners. They may be used by those companies to build a profile of your interests and show you relevant advertisements on other sites. They do not store personal information that could identify you directly, but are based on uniquely identifying your browser and internet device. If you do not allow these cookies and web beacons, you will experience less targeted advertising. The website does not track users when they cross to third party websites, does not provide targeted advertising to them and therefore does not respond to Do Not Track ("DNT") signals.
Managing Your Cookie Preferences
You have many choices with regards to the management of cookies on your computer. All major browsers allow you to block or delete cookies from your system. However, if you do decide to disable cookies you may not be able to access some areas of our website or the website may function incorrectly. To learn more about your ability to manage cookies and web beacons and how to disable them, please consult the privacy features in your browser or visit www.allaboutcookies.org.
This website may link through to third party websites which may also use cookies and web beacons over which we have no control. We recommend that you check the relevant third parties privacy policy for information about any cookies and web beacons that may be used.


 Use Global Configuration to adjust the chart settings.
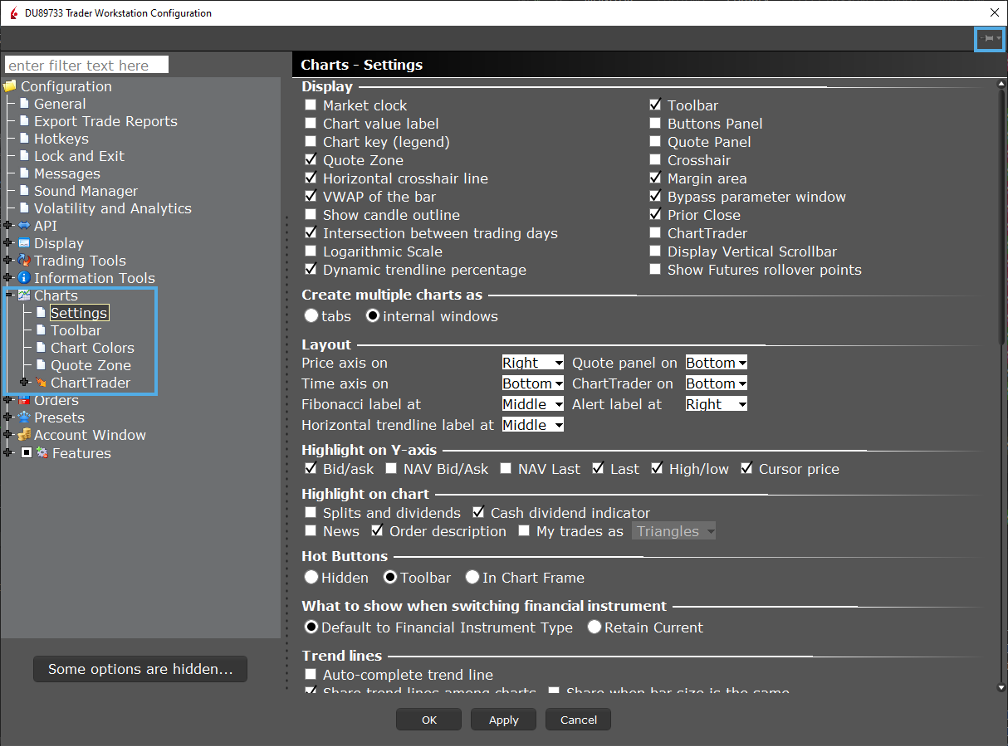


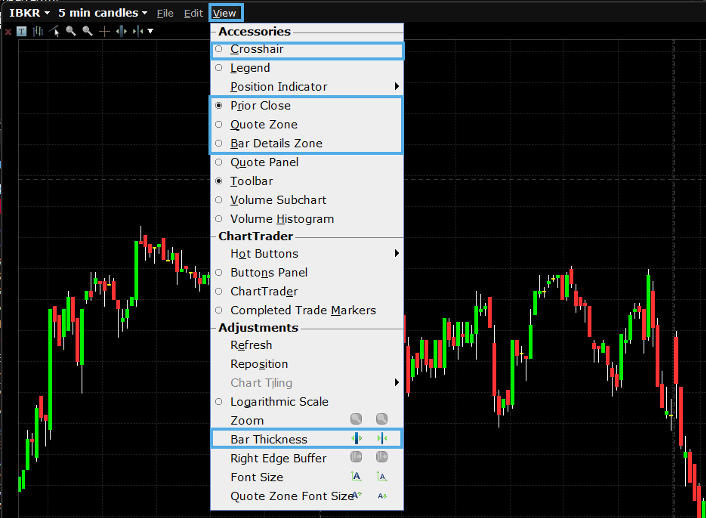
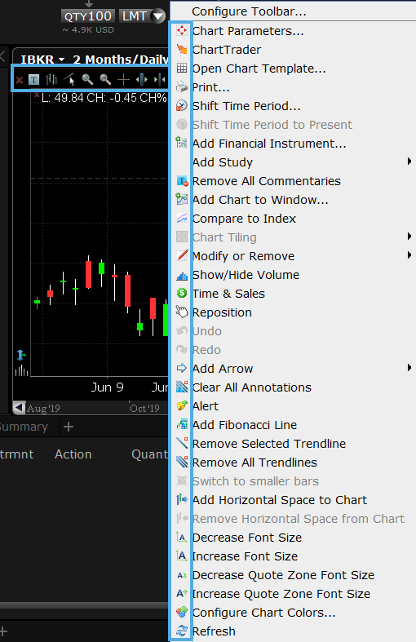 Let’s click on Add Study and move this icon to the top of the list by clicking Move Up. Lastly, just scroll down the list to see more options. Let’s see the new study icon on the chart on the far left.
 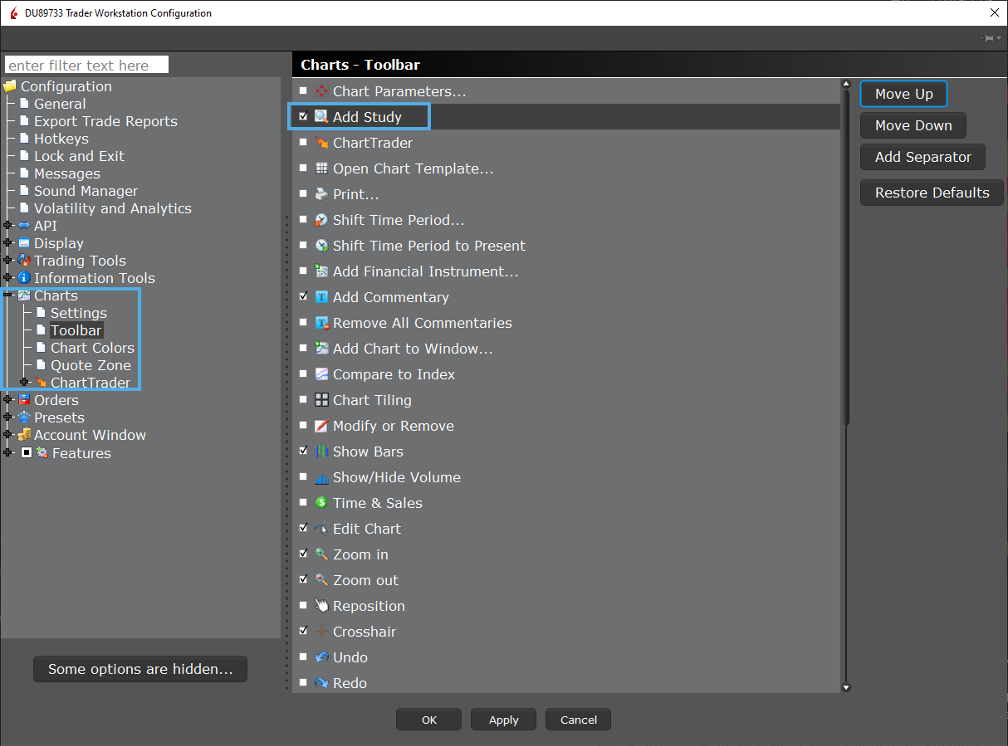 ShortcutTip: The Chart Parameters icon may also be added to the Toolbar. This shortcut enables you to access the Additional data and Features panel quickly. Likewise, you can add icons to bypass the View menu that provide shortcuts to Add Studies or Show and Hide Volume. Simply check next to each icon what you want to add to your Toolbar. Click Apply and ok to view the changes in the chart.
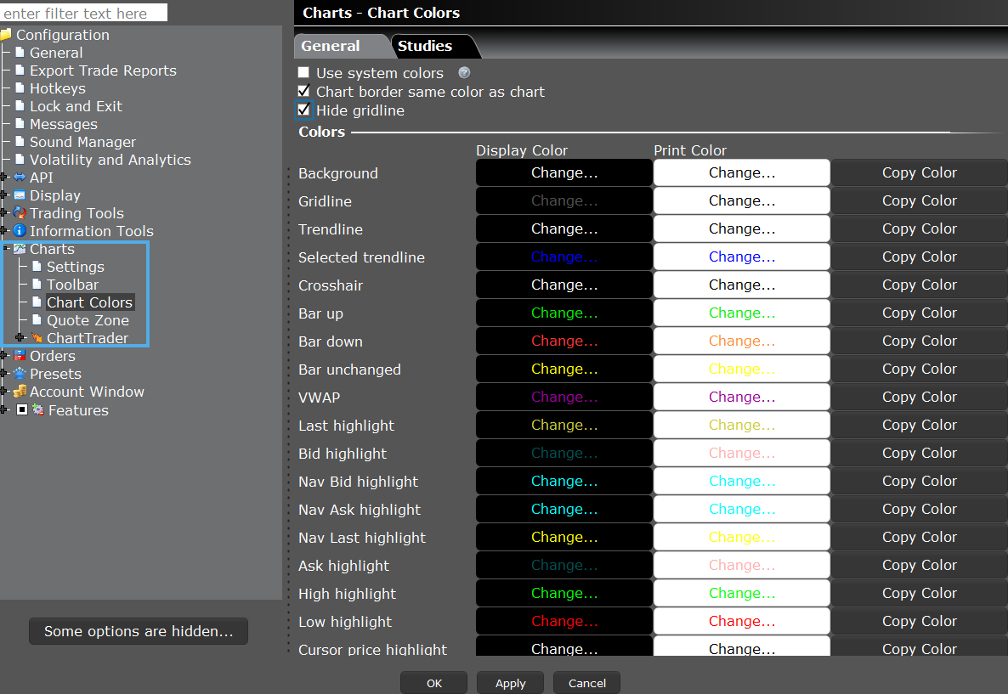
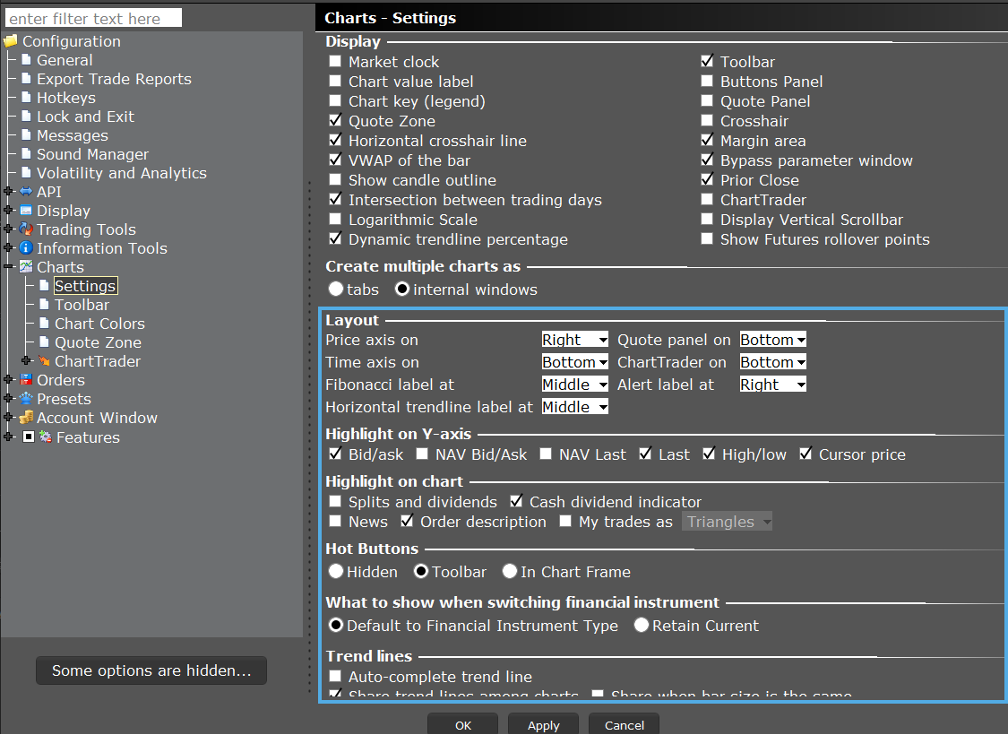
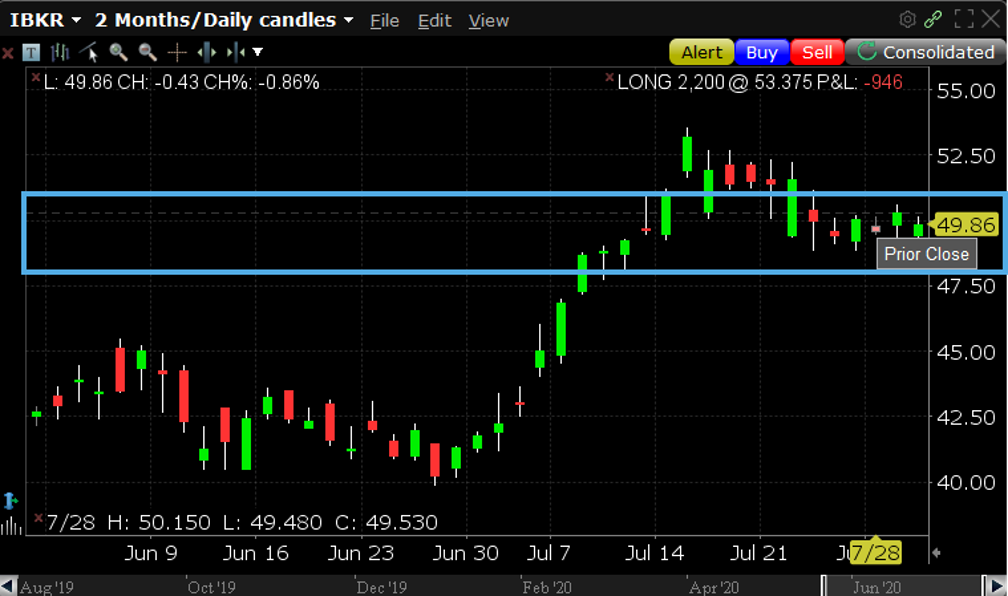
 Take time to review the selections in Settings including those in the miscellaneous area. Use the Apply button to see how these affect the chart display. There is a lot of material in this lesson, but the most important thing to remember is how to access Global Chart Configuration.


HOW TO RESIZE STUDY OR INDICATOR BOX WITHIN THE CHART WINDOW
Hello Ranjit, thank you for reaching out. We hope this page from our online user guide answers your question: https://www.ibkrguides.com/tws/usersguidebook/technicalanalytics/charts%20toolbar.htm?Highlight=resize%20study%20box
Lately (10.30) TWS) introduced the following tab text style: TSLA NASDAQ or SOXL ARCA instead of just TSLA and SOXL that leads to unnecessary interface clogging. It would be nice to remove the detailed text option for the sake of brevity or have the choice of the text style. Also I’ve been waiting for years for chart tabs order rearrangement possibility which would be an extremely valuable addition. Any hopes of this?
Hello, thank you for reaching out. To change the text style in TWS:
1. In Mosaic, click on the File menu and select Global Configuration. In Classic TWS, click on the Edit menu and select Global Configuration.
2. Expand the Display section and select Style.
3. In the Font section, you can change the Font Face, Size, and Style.
4. Click OK for the changes to take effect.
You will need to restart TWS for the new text style to be applied.
We currently do not have plans to support multiple tabs within TV. However, custom layout allows you to open more than one chart in different window layout. Then, you can rearrange the chart cell within that same window. Please view this link for more information: https://www.tradingview.com/blog/en/charts-can-now-be-moved-within-a-layout-11262/
We hope this helps!
Hi can I add earnings into tws chart in IBKR?
Thank you for reaching out. In order to view Earnings on a chart, you must first add the Quote Panel. Click the View menu option within the chart and select Quote Panel. The Quote Panel will now populate on your chart. Click the small wrench icon at the far right of the Quote Panel and the Configuration window will populate. Under Available Columns on the right side you will see various sections for Fundamentals. Search these sections and find the Earnings value you wish to view (Earning before taxes, EPS Change, EPS Growth, etc.). Once you have found the one you wish to add, left click it to highlight the column, click the Add button in the middle, then click Apply to save your changes and OK to close the window. You will now see the Earnings value in your Quote Panel. https://www.interactivebrokers.com/faq?id=32650817
We hope this helps!
how to toggle quote zone (on chart, right top corner) numbers to % on tws?
Thank you for asking. You can configure the Chart- Quote Zone in Global Configuration. After logging in, navigate to Global Configuration. Then click Charts in the left pane and Click Quote Zone. Please review the available fields for the Quote Zone in the link below. Specifically, take a look at the Change %.
https://www.ibkrguides.com/traderworkstation/charts-quote-zone.htm?Highlight=Quote%20Zone
We hope this helps!
All tis is good but has anyone come up witha wsy to shift the entire chsrt to the left to leave some margin on right side
Is there away to do foot print chart?
Hello Lex, thank you for asking. This feature is not available at this time. However, we have passed this feedback along to the appropriate team. If you have a specific suggestion(s) on how we can improve, we would like to hear it! Please review this FAQ on where you can leave your feedback: https://www.ibkr.com/faq?id=32653353
You can also post in the Feature Poll in Client Portal where other IBKR users can comment and vote: https://portal.interactivebrokers.com/portal/#/suggestions
How do I add automatically updated horizonal lines in intraday chart from the high and low of the day?
Hello, thank you for asking. Please view more details on all our available indicators in this User Guide: https://ibkrguides.com/traderworkstation/chart-indicators.htm
We hope this helps!
as usual tws is a nightmare to use.
Hi, thank you for reaching out to us and we are sorry to hear this. Can you please describe the issues that you are experiencing in more detail so we can best assist? We would appreciate the opportunity to turn around your experience.
Hi, in the trading view application within tws I am missing the possibility to show the earning dates in the chart like it is shown in the trading view software itself. I do not mean the earnings displayed in the quote chart like described above, but all historic earnings and the next upcoming date directly at the timeline of the chart. In the trading view software there are event settings in the menu. These are missing in the trade view application within tws. Can this be fixed? That would be more than great.
Hi Tom, thank you for asking. No, this is not possible at this time. However, your feedback has been passed to the appropriate team. Please reach back out with any additional questions. We hope this helps!
Hi, how can I show earnings dates (not earnings) in the chart, like the ex-dividend dates? A side thing is sometimes, the ex-dividend dates are missing for some stocks even dividends are paid. Thanks.
Hi John, thank you for reaching out. This has no ETA yet. We have passed this feedback to the appropriate team.