
- Solve real problems with our hands-on interface
- Progress from basic puts and calls to advanced strategies
Interactive Options Course
Lesson 5 of 9
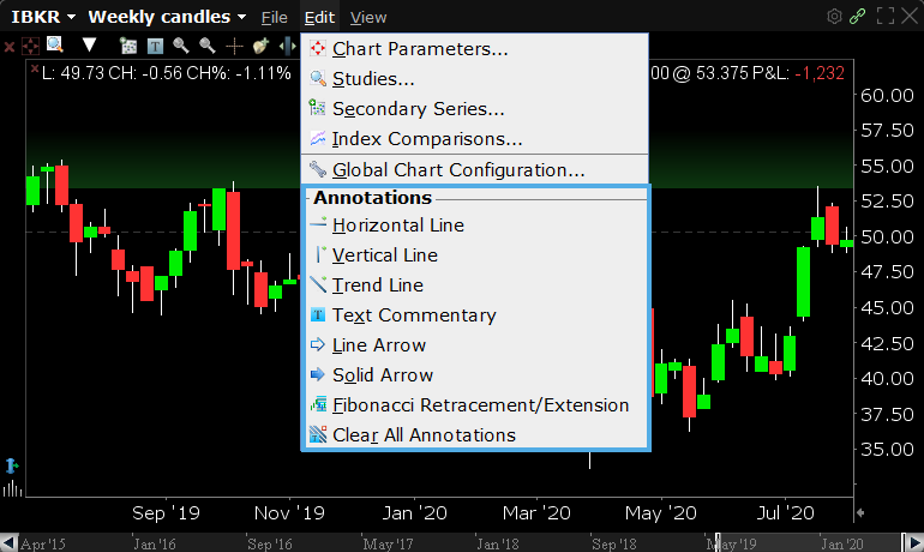

Overall, right-clicking allows you to edit the chart and add a horizontal line.
Hover above the line and right-click again to open the edit function and you can add or reposition lines. Adding a parallel line to any trendline enables you to create a channel, often watched by traders as a path of support and resistance.
 I will now activate one of these lines and select Remove All Annotations to clear the display of lines. In order to add an upward sloping line beneath an asset’s price, I’ll position the cursor at the base of the bar, marking the start of the price climb, then I’ll left-click to turn the cursor into a crosshair; now I’ll drag the cursor to the end point and release the left-button to place the line. Let’s activate this line by hovering above it, right-click to Add a parallel. Then, reposition the additional line with your cursor to create a parallel channel. For greater accuracy when adding lines, you may want to create an additional margin to the right of the chart. To do this, hover your cursor above the small left-pointing arrow to the lower right of the chart. It will change color as you hover directly above it. Click left and drag to the left to create more space. This will allow you to extend the trendline out into the future. If you don’t see the arrow, you must enable Margin Area from the Settings Menu in Global Configuration. As a reminder, Global Configuration may be opened by clicking the TWS File menu.
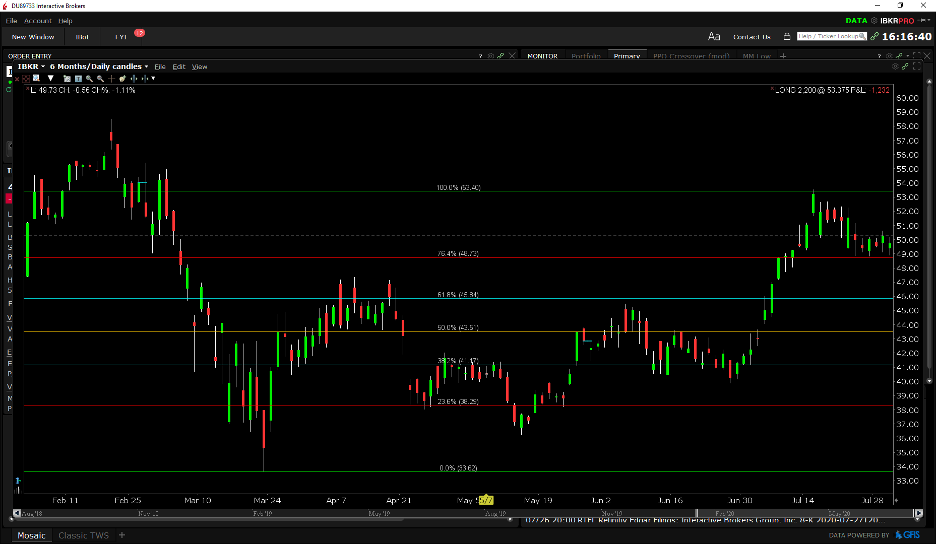 To dissect a downtrend, select Add Fibonacci line from the right-click menu, but this time start at the highest point on the chart, use the left click to anchor to the peak and hold the mouse key down and locate the bottom of the price action before releasing. The chart will then display Fibonacci lines to depict potential retracement areas. Now that you are familiar with adding trendlines of support and resistance to your TWS charts, let’s move on to the next charting lesson in Traders’ Academy.
For specific platform feedback and suggestions, please submit it directly to our team using these instructions.
If you have an account-specific question or concern, please reach out to Client Services.
We encourage you to look through our FAQs before posting. Your question may already be covered!
The analysis in this material is provided for information only and is not and should not be construed as an offer to sell or the solicitation of an offer to buy any security. To the extent that this material discusses general market activity, industry or sector trends or other broad-based economic or political conditions, it should not be construed as research or investment advice. To the extent that it includes references to specific securities, commodities, currencies, or other instruments, those references do not constitute a recommendation by IBKR to buy, sell or hold such investments. This material does not and is not intended to take into account the particular financial conditions, investment objectives or requirements of individual customers. Before acting on this material, you should consider whether it is suitable for your particular circumstances and, as necessary, seek professional advice.
The views and opinions expressed herein are those of the author and do not necessarily reflect the views of Interactive Brokers, its affiliates, or its employees.


I have drawing tool set wherever i click, it draws trendlines. When i change tool to say reposition tool, it lets me repostion the chart once and defaults back to drawing tool. How shall i come out of this behaviour?