
- Solve real problems with our hands-on interface
- Progress from basic puts and calls to advanced strategies
Interactive Options Course
Lesson 2 of 9
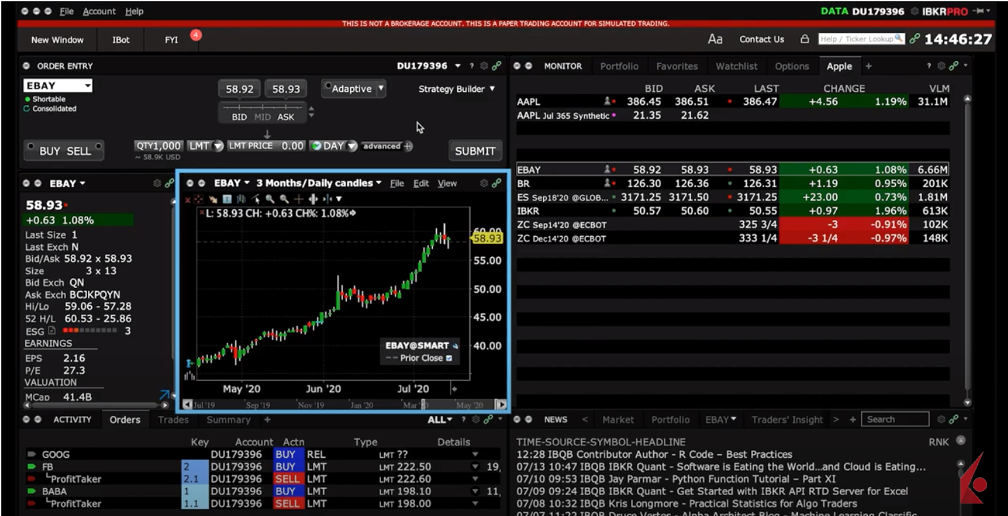
You’ll notice that this chart is color-linked so if I select a ticker from the monitor panel, the chart will update automatically.
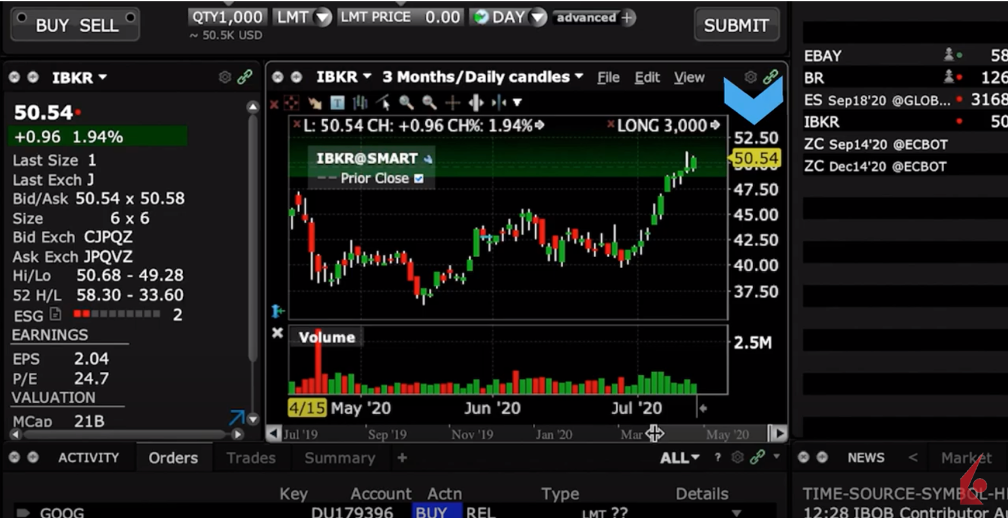
 In the title area, you’ll see the ticker and a drop-down menu to select a different ticker, plus a drop-down to adjust the time period of the chart. Let’s select a new time period and see it display.
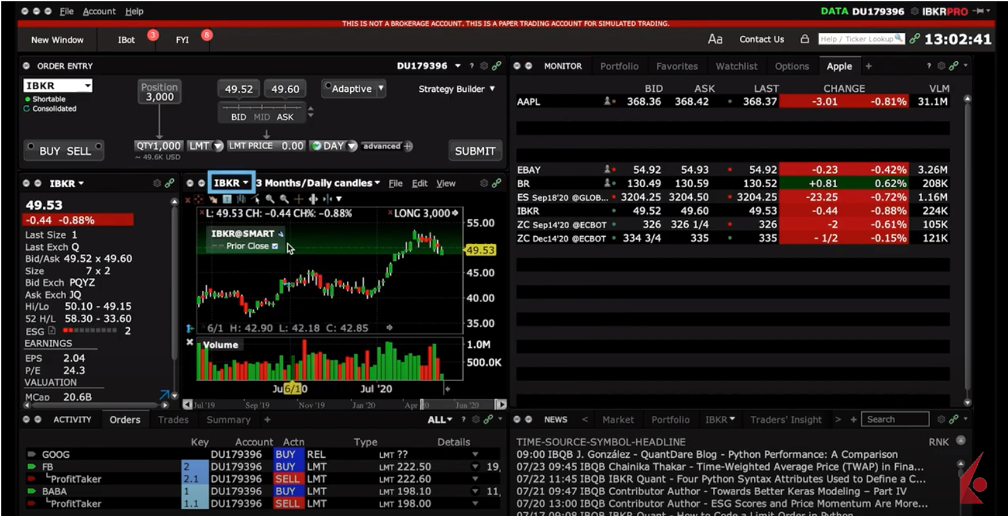
Price is shown on the Y-axis and time is shown on the X-axis.
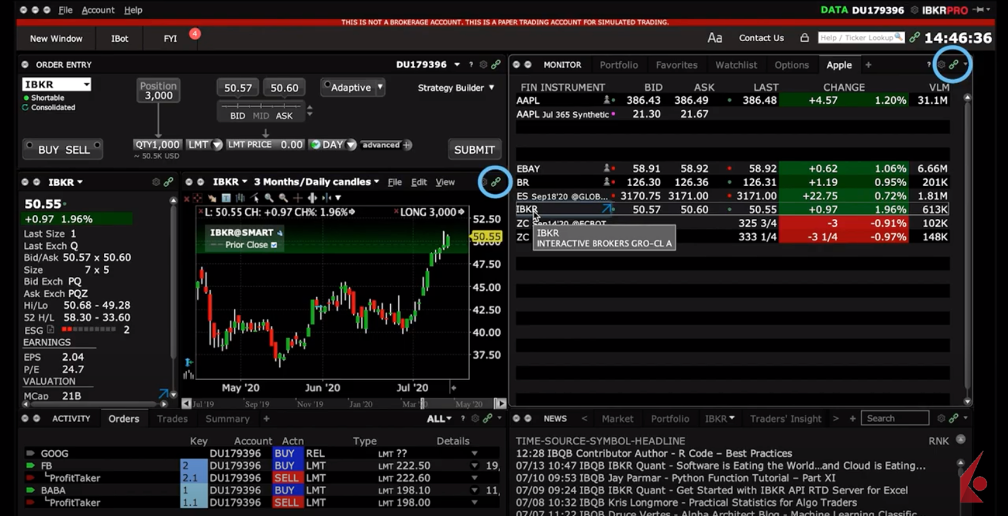
 This chart panel is completely customizable, and this lesson will show you how to enable or disable chart features.
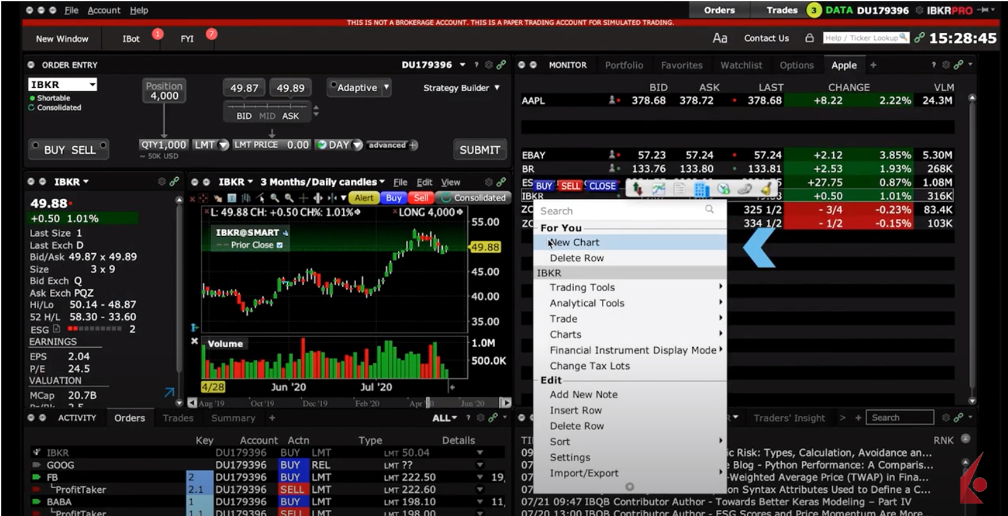
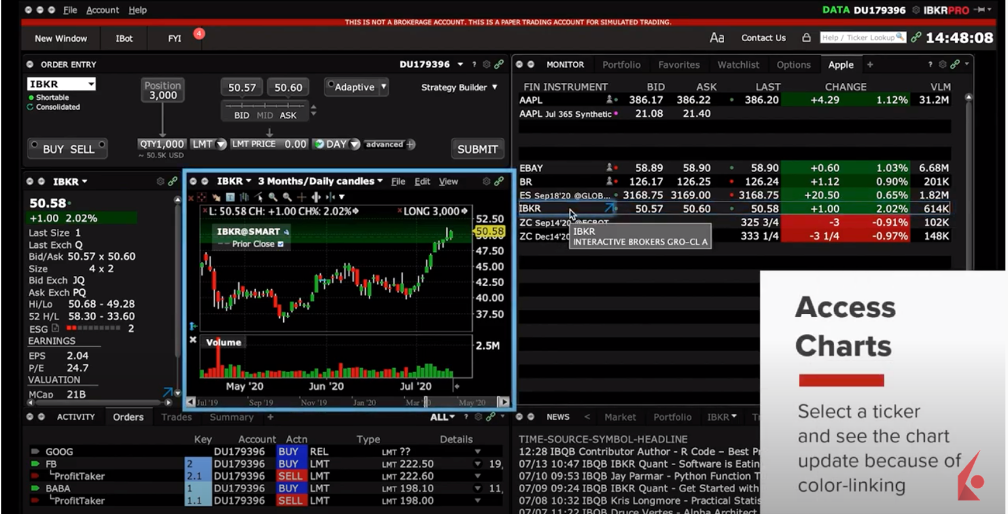 Second is the Floating icon – Click right on a ticker to reveal a floating icon – you may choose the chart icon here to boot up a standalone chart window. This chart can now be repositioned on a secondary screen or left as a standalone chart to refer to in the background.
 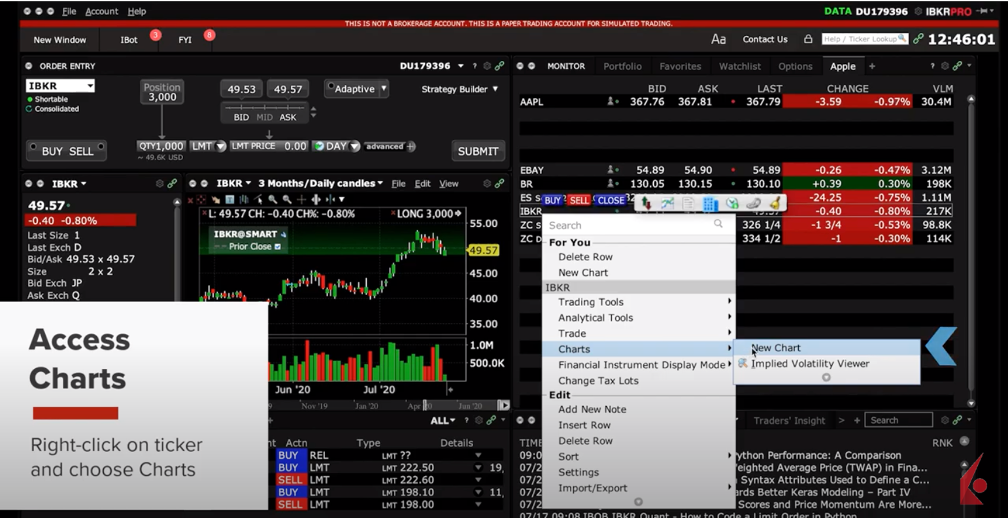 Finally, from the New Window button – Highlight a ticker on screen and use the New Window button in the upper left corner, and under the General Tools category, select Chart, then Chart again.
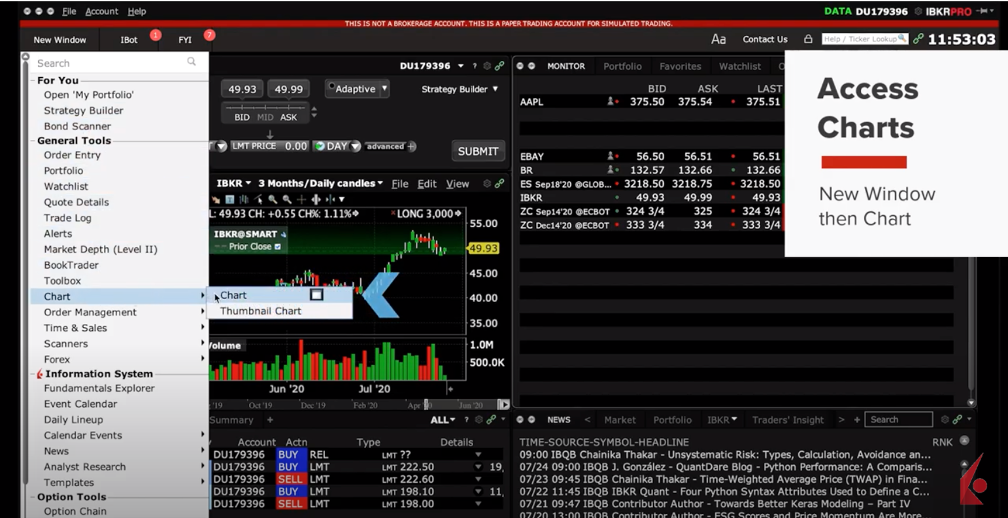
 Once you open a chart, you should see the Chart Parameters panel, which later can be bypassed by using the checkbox at the lower left.
 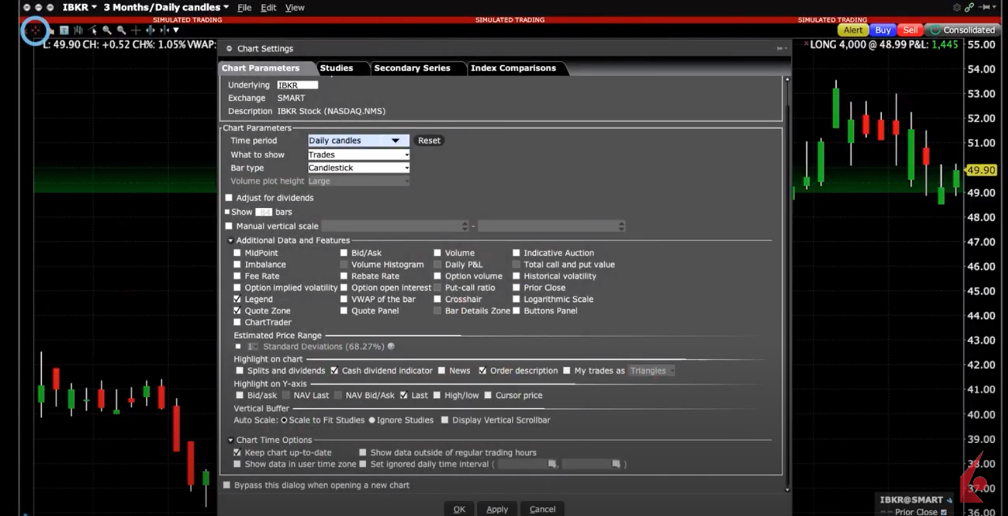 If you have already bypassed this panel, you can always return to it via the Edit dropdown menu and by selecting Chart Parameters.
 Since charting a single security is one of the most popular reasons behind using TWS Charts, let’s use this as our starting point on the Chart Parameters tab. You will notice there are three buttons across the top of this panel:
 For a single ticker, if the underlying entry field is not already populated you can do so here – select Stock and SMART for destination.
 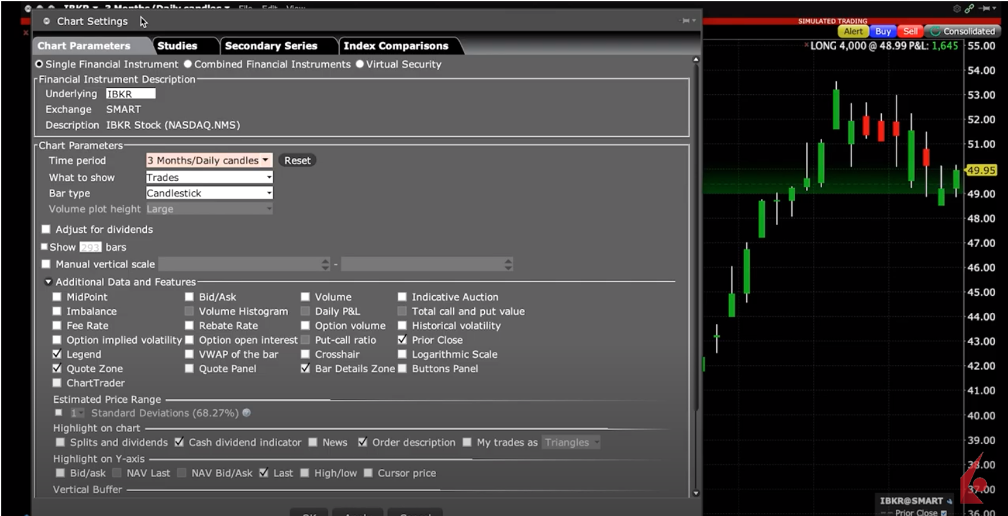 Below, determine the time frame and frequency for what you want to display. You will see that there are two colored boxes – above in blue is the Bar or Candle Size, depending on what you have selected from the Bar Type drop-down menu. Below, in pink, are more time periods to choose from.
 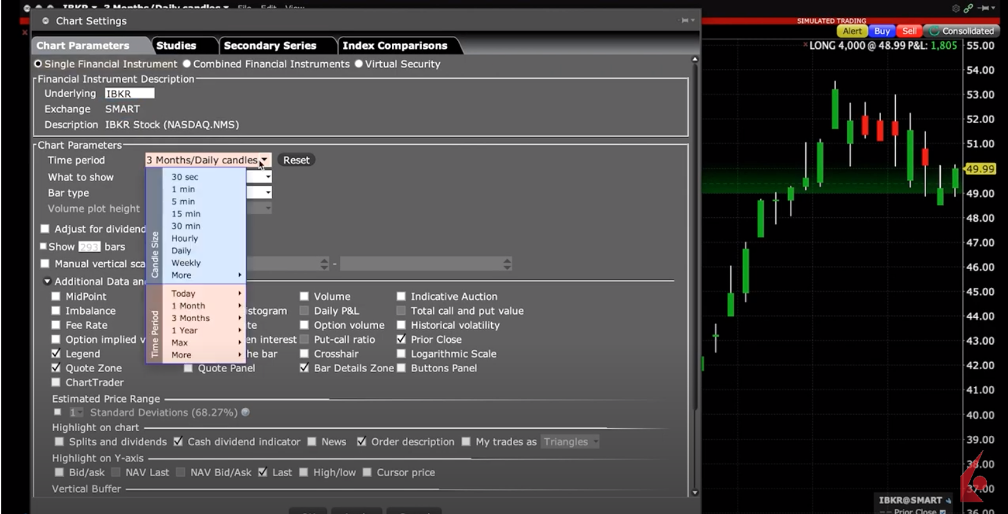 I’m going to select a two-month candle chart and click Apply to view the resulting chart. Note that by clicking Apply rather than OK I can maintain the Chart Settings menu and make additional choices with the box open. If you lose the box and want to reopen it, it is under the Edit menu and Chart Parameters. For example, if you want to know what the midpoint would look like in your display, select it from the Additional Data and Features section and click Apply. Just deselect if you want to remove it and click the Apply button. You can test several choices to see how they appear and whether you want to retain them in the display.
 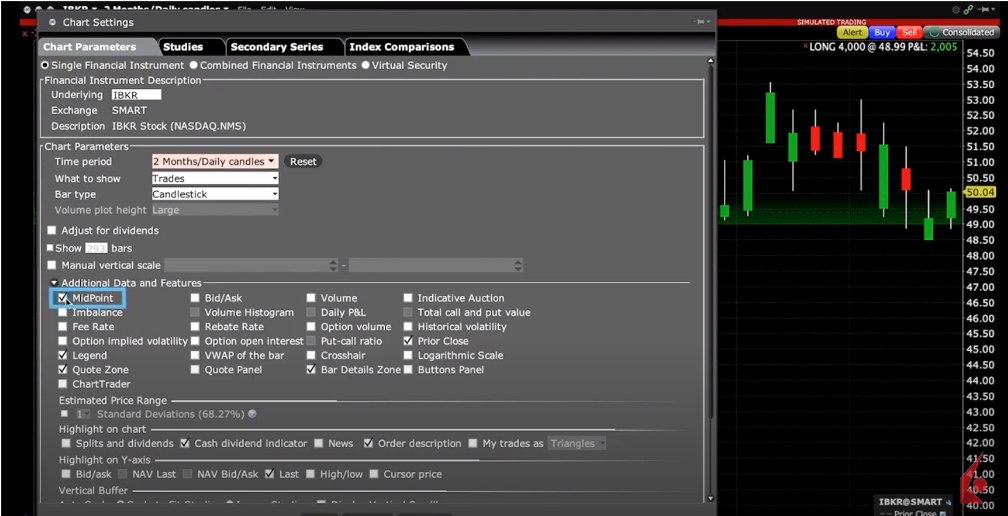 You may notice several boxes are greyed out when the selection does not apply. For example, some options-related data could only be shown on the display when selecting the option price data. You may display option volume broken out into call and put values by underlying, and you can also display historic volatility for a security and the associated implied volatility derived from its options on the same display.
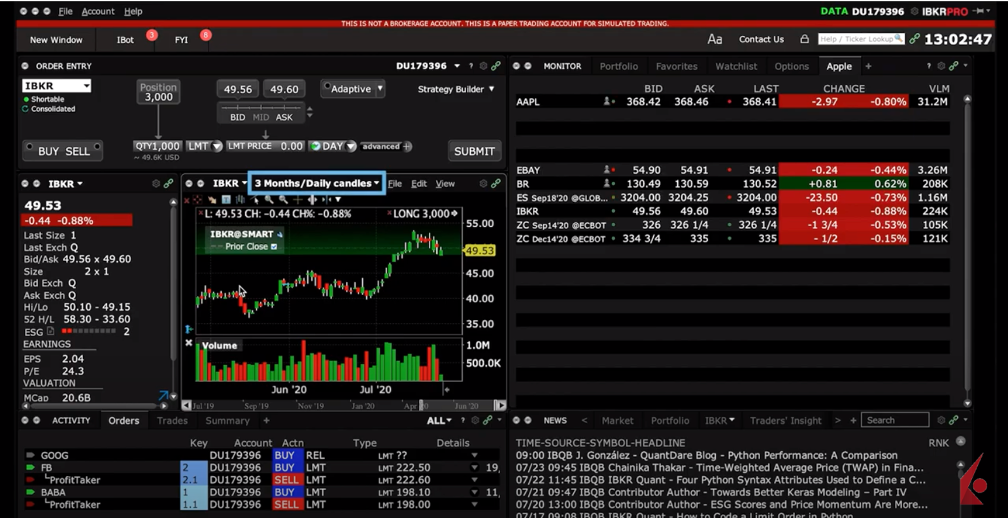
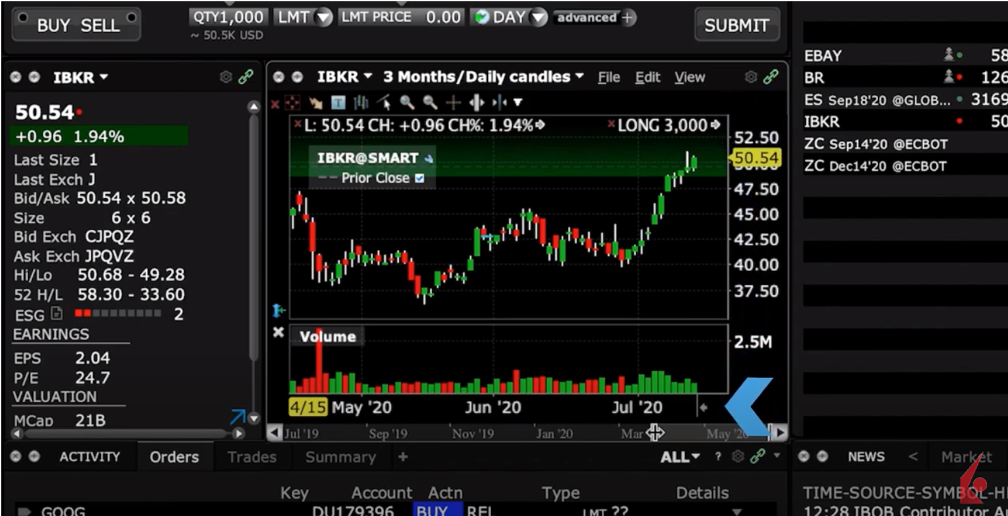
 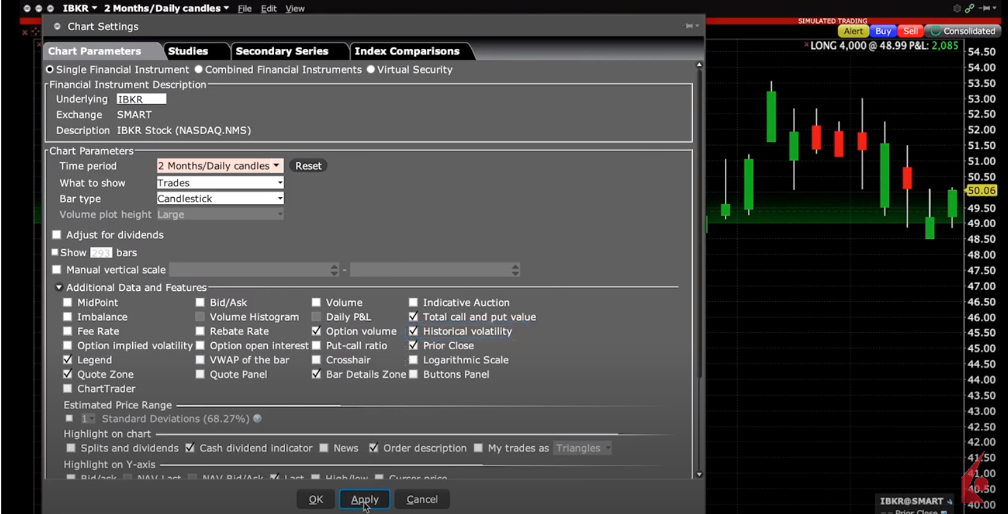 Note that there are two references to Volume for your display. Selecting Volume will include volume bars below the chart from intraday to the maximum history TWS will allow. However, the selection for Volume Histogram is only available for intraday time frames and will display as a stack to the right of the chart. The maximum period supporting the Volume Histogram is 8-hours.
 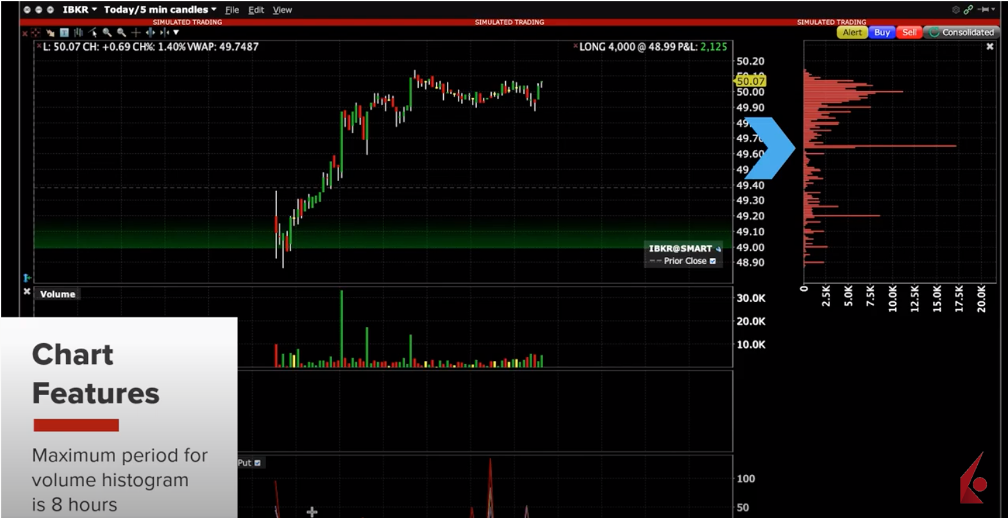 Remember, if you make any selections here TWS will remember your choice for future charts. We will discuss the Quote Zone and Bar Details Zone in a later video when learning how to configure your charts but note for now here are these selections on this panel.
 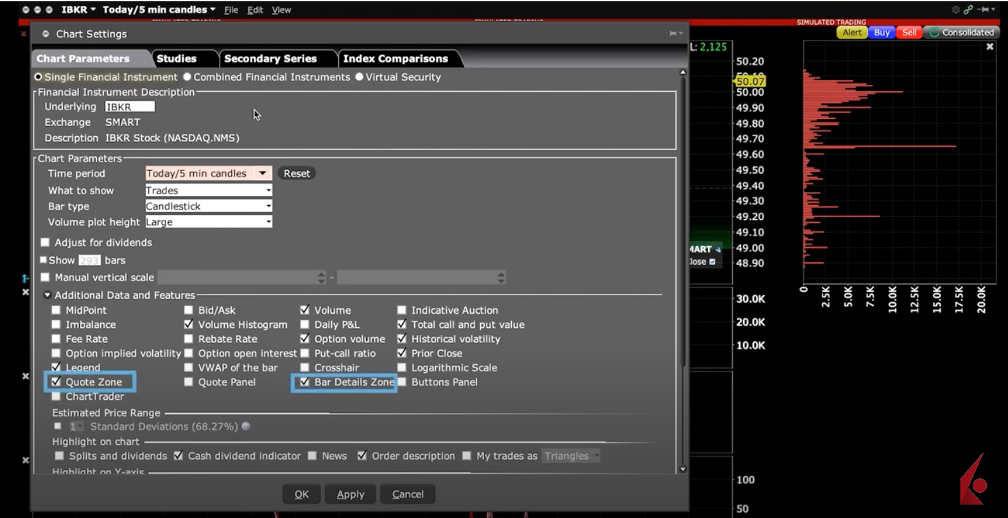 Also notice that there is a selection for ChartTrader. This can be enabled in order to make trades directly from charts. Let’s turn them on so you can see them display in the chart.
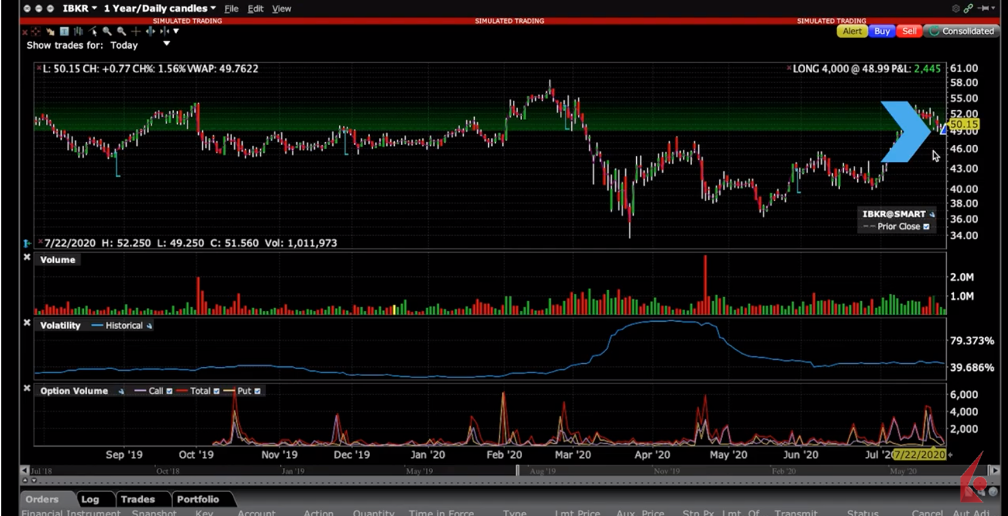
 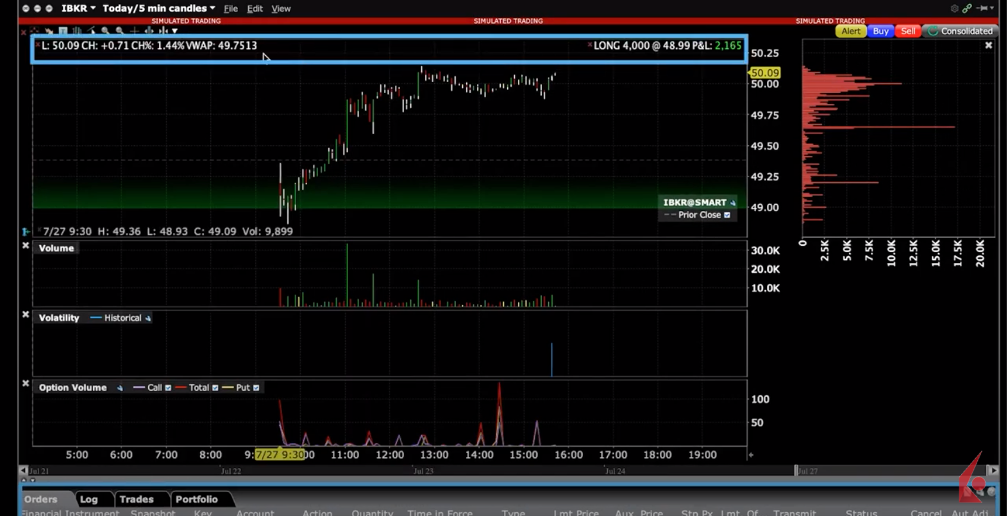 Another useful feature is the Logarithmic Scale selection. This will be of most use when examining charts displayed over longer time periods or with a larger price range. Let’s adjust the time period to 1 Year and click apply. Log charts try to common size the price scale to keep price movements comparable.
 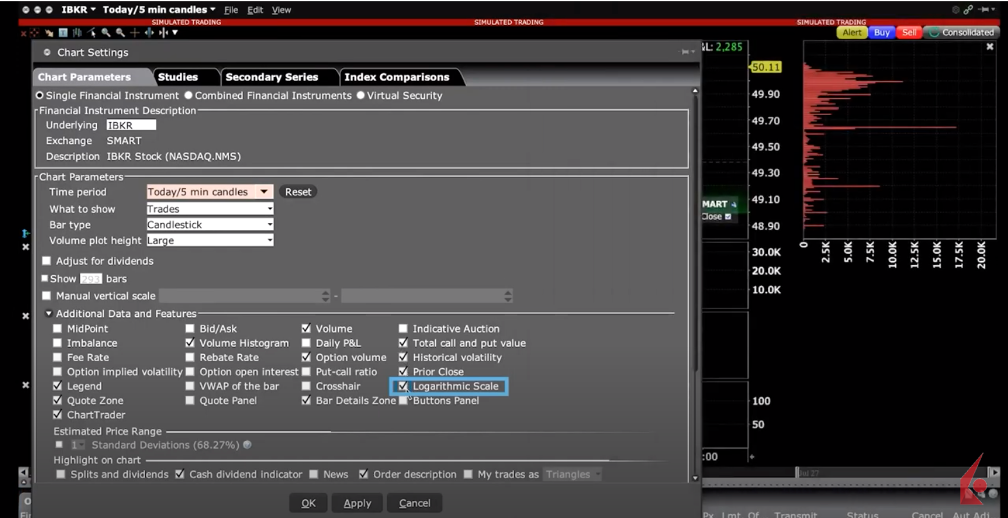 You may add VWAP to price bars from the Additional Data section, and from the Highlight on Chart selections you may highlight your own trades within a bar as Dashes or Triangles to help more easily identify your entry and exit points over time. See the Triangle appear.
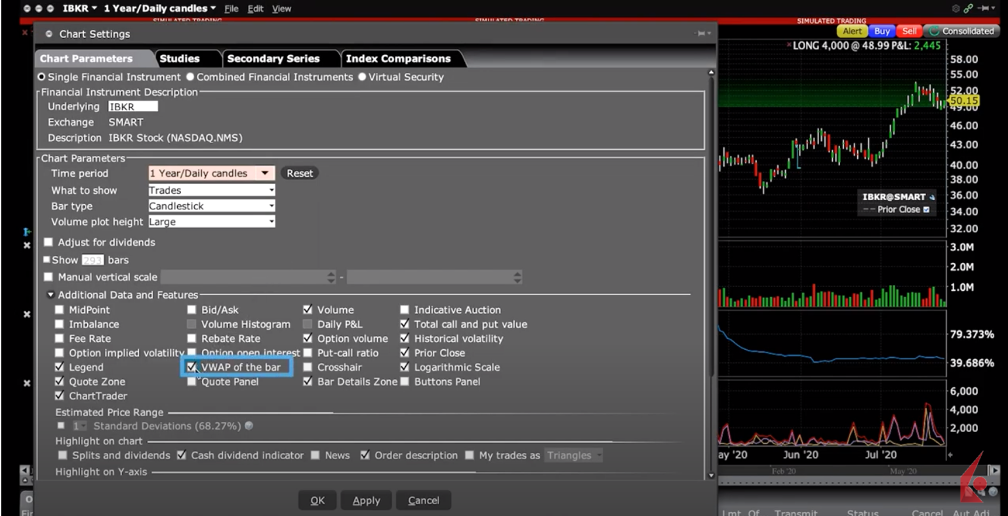

 Back on Chart Parameters, in the line below, users can determine what values may be highlighted on the Y-axis, such as bid/ask, high/low or last prices or the value associated with the position of the cursor. Let’s highlight high/low and click apply.
 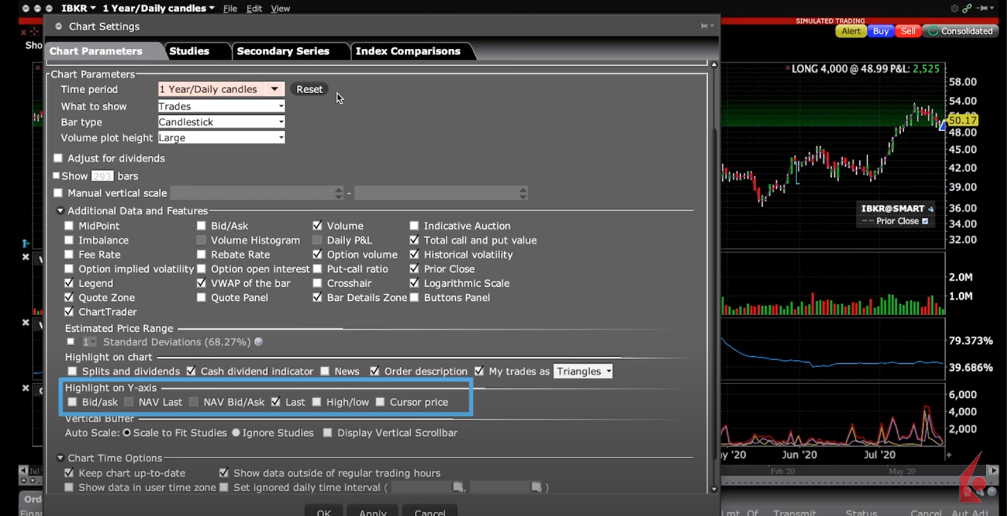 See the highlighted colors display over here on the Y-axis.
 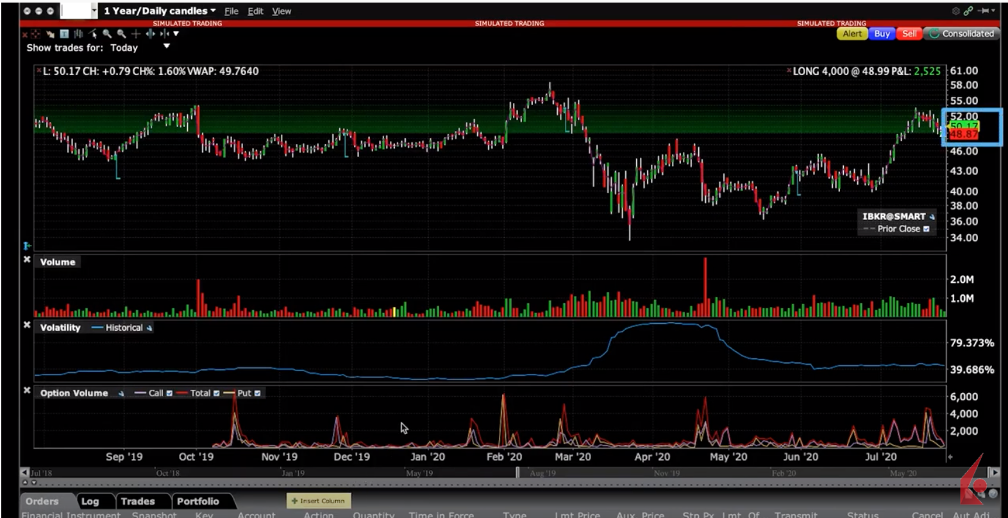 At the bottom of the Chart Settings display page are Chart Time Options. You will probably want to keep your charts up to date, but also show data outside of regular trading hours. Note that this is very useful when watching stock index futures that have multiple overnight or intraday sessions.
 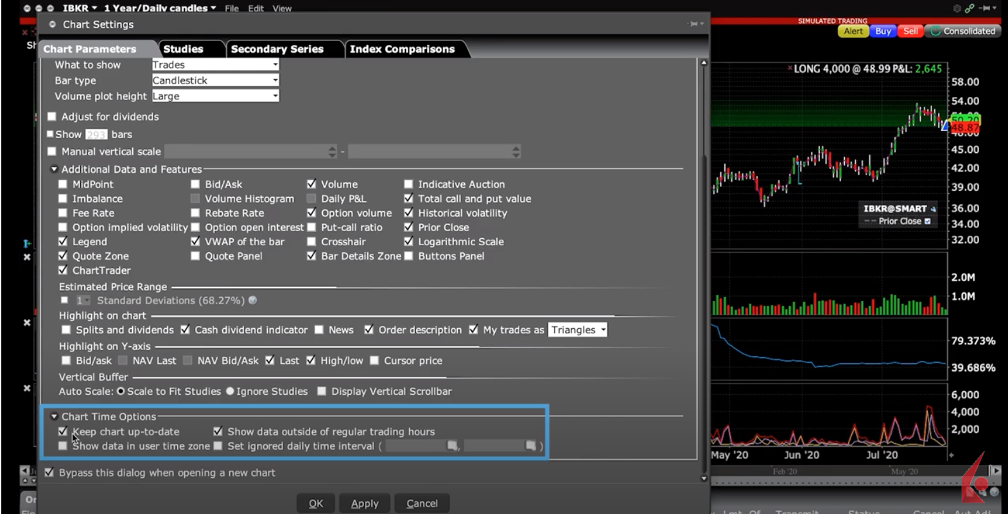 While there is a lot more to configuring TWS Charts you should now have a better understanding of the various ways you can open a chart, as well as how to locate and drive display choices from the Chart Settings menu. Now that you we have covered basic chart configuration, let’s turn our attention to the next lesson on charts in Traders’ Academy.
For specific platform feedback and suggestions, please submit it directly to our team using these instructions.
If you have an account-specific question or concern, please reach out to Client Services.
We encourage you to look through our FAQs before posting. Your question may already be covered!
The analysis in this material is provided for information only and is not and should not be construed as an offer to sell or the solicitation of an offer to buy any security. To the extent that this material discusses general market activity, industry or sector trends or other broad-based economic or political conditions, it should not be construed as research or investment advice. To the extent that it includes references to specific securities, commodities, currencies, or other instruments, those references do not constitute a recommendation by IBKR to buy, sell or hold such investments. This material does not and is not intended to take into account the particular financial conditions, investment objectives or requirements of individual customers. Before acting on this material, you should consider whether it is suitable for your particular circumstances and, as necessary, seek professional advice.
The views and opinions expressed herein are those of the author and do not necessarily reflect the views of Interactive Brokers, its affiliates, or its employees.


I want 78 minute candles can you help?
Hello Amit, thank you for reaching out. At this time, 78-minute candles are not available. You can view the current available candle sizes by clicking Charts> New Charts> Click the candle size in the upper left corner> More. We hope this helps!
how can I set a chart default to see larger (vertically) candlesticks
Hello, thank you for reaching out. You can edit charts to see larger candlesticks in TWS by clicking the Candles button in the upper left corner and picking your desired candle size. You can set a custom chart as default by clicking the File menu> save Chart Template As… > and Assign a name. Please be sure to save your chart template. Next, open a new chart and click the File menu followed by Open Chart Template. You can check the option for Set as a default next to your previously saved chart template. We hope this helps!
How to change the order of the studies in the chart?
Hello, we appreciate your question. At this time, it is not possible to change the order of the studies in the chart.
Please explain the parameter: What to show. Thanks!
Robust charting features are available across IBKR’s trading platforms. The overview article has details on the charting capabilities of each platform to help you decide which one meets your needs. Let me know if you have any other questions!
Hello, in any Chart I have configured “keep chart updated” in the parameters. The candles do mostly auto-update, the Bollinger Bands never. What can I do?
Hello Ulf, thank you for reaching out. Please submit a web ticket for this inquiry so our team can investigate and provide you with a detailed answer: https://spr.ly/IBKR_CreateWebTicket
Thank you, issue solved. They told me to replace SMA by EMA.
How do you add the position size and pl on the right side on the chart itself. Like indicated on the chart?
Hello, thank you for asking. Please check out this Traders’ Academy course for Detailed TWS Chart Configuration. It includes instructions on how to add P&L to the chart. https://www.interactivebrokers.com/campus/trading-lessons/tws-chart-config/
We hope this helps!
I would like volume profile plotting option for selected period intraday. I also would like option to plot inside the chart with volumes bars left to right horizontally. In another note, I would like to plot secondary security/index chart with primary security with candle stick and not just line that seems currently only available option.
Hello, thank you for asking. IBKR will reflect upcoming dividend payments as an accrual in client accounts on or shortly after the ex-dividend date. Upon receipt of the funds through our clearing agent or depository, the accrual will be reversed from the account and the cash dividend will be allocated to the Cash Balance of the account. This action typically will occur on the announced payment date of the dividend.
Clients may view the accrual reversals and the final cash dividend allocation on their daily or monthly account statements. Please visit this FAQ for instructions on how to run the statement:
https://www.ibkr.com/faq?id=27290344
Also, IBKR offers a Dividend Reinvestment Program that is available to IB LLC, IB CAN, IB HK and IB UK clients only. Please view this FAQ for more information: https://www.interactivebrokers.com/faq?id=28226119
We hope this helps!
Is there anyway to increase the number of tickers available in the drop down box at upper left corner of chart? It appears that it is limited to 10 currently. Thanks
Hello Dave, thank you for asking. At this time, only ten tickers are available in the chart. In the future, if you have any specific suggestions, please submit them using the instructions in this FAQ: https://www.ibkr.com/faq?id=32653353
Question. I an new to TWS, why the stock chart is different from option chart? I want to trade only options and get used to trade from chart where I can see the strike and live data
Hello, thank you for reaching out. You can find option details in the Quote section. On top of the charts, you can find the Options Chain, Option Wizard and Option Analysis. Having selected a contract in Option Chain, you can switch tabs to Charts for the product you specify. Please note: charts for option spreads are not yet supported.
Also, you can create a custom layout and add the following widgets from the Custom Layout Tool Box: Chart, Option chain, Quote details, Rapid Order Entry.
Please note that a new layout for options trading is in the pipeline with no ETA at this time. Please reach back out with any additional questions. We are here to help!
Hi, when landscape view chart price view as shade as it is blacked in right side . how decrease the chart size manually
I’d like to view continuous Soybean futures (ZS) price chart since it’s index inception in COMEX. However there is an issue here: – I use ticker ZS ∞ Jan14’26 @ CBOT chart (in TWS IBKR), but the chart only show history price of up to 1 – 2 years. This is too short duration. Please help. Other trading platform can show history chart trace back to way many years.
Hi Mike, thank you for reaching out. Feel free to consult the IBKR Market Data Assistant to find the best market data for your needs.
https://ndcdyn.interactivebrokers.com/sso/Login?action=CS_MARKET_DATA_ASSISTANT
If you still cannot find what you are looking for, please feel free to submit a suggestion using the instructions in this FAQ: https://www.interactivebrokers.com/faq?id=32653353
We hope this helps!
Hola, cómo puedo ver el gráfico en en centro de la pantalla? me refiero a que no puedo arrastrarlo, y siempre la vela que se está creando está al limite derecho de la pantalla. Me gustaría colocar el gráfico en el centro para poder hacer proyecciones del precio futuro. Me pueden ayudar?
Hola Víctor, gracias por preguntar. En TWS, puedes hacer clic en la esquina superior derecha para configurar el tamaño del gráfico. También puedes arrastrarlo. Para obtener más información sobre los gráficos de TWS, consulta esta guía del usuario: https://www.ibkrguides.com/traderworkstation/chart.htm?Highlight=charts
¡Esperamos que te sea útil!
Hi, How can I add the candle countdown timer in the charts?
Hi Khan, thank you for asking. To get the candles on your chart to show current time, please review: https://www.interactivebrokers.com/faq?id=31756337
We hope this helps!