
- Solve real problems with our hands-on interface
- Progress from basic puts and calls to advanced strategies
Interactive Options Course
Lesson 3 of 6
New to Interactive Brokers?
Technical analysis is a method of evaluating securities based on statistical trends and historical price and volume data rather than intrinsic factors such as company earnings or management.
It focuses on studying charts and patterns to forecast future price movements. One of the key aspects of technical analysis is identifying momentum, which refers to the strength and speed of price changes in a particular direction.
To identify momentum using technical analysis, several tools and techniques are often employed. In the last lesson we covered the Momentum indicator, let’s look at a few more.
Today, we’ll open TWS and open Trading Central, a new tool that has an abundance of charts, studies, plus educational material too.
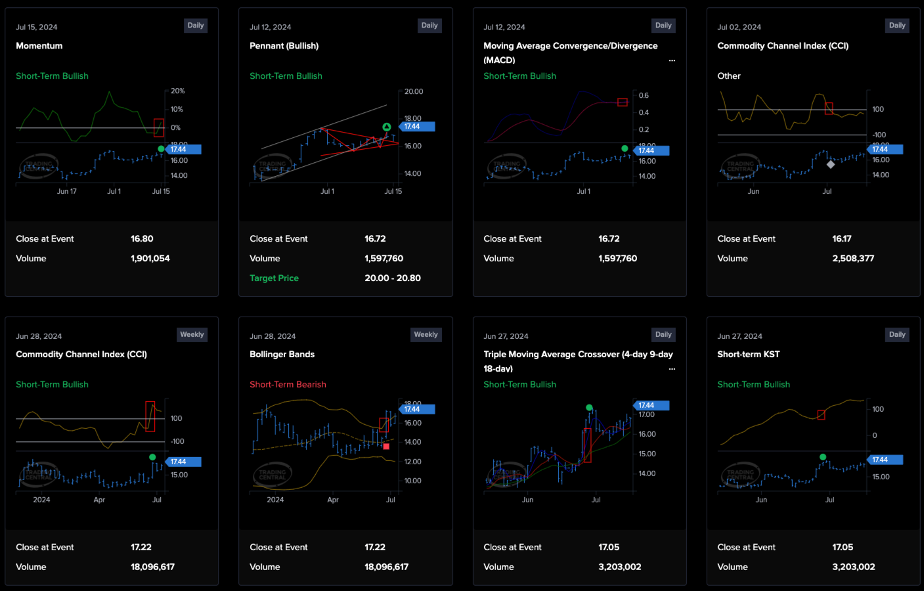
These indicators quantify the rate of price change over a specific period, helping investors assess the strength of current trends.
Examples include the Relative Strength Index (RSI), which measures the speed and change of price movements to indicate overbought or oversold conditions, the Moving Average Convergence Divergence (MACD), which identifies changes in momentum based on the difference between short-term and long-term moving averages.
Investors often examine price charts to identify trends and momentum directions. Trends can be upward (bullish), downward (bearish), or sideways (neutral).
Various tools, such as trendlines, moving averages, and chart patterns like triangles or channels, help analysts visualize and confirm trends. For instance, a series of higher highs and higher lows may indicate an uptrend, suggesting bullish momentum.
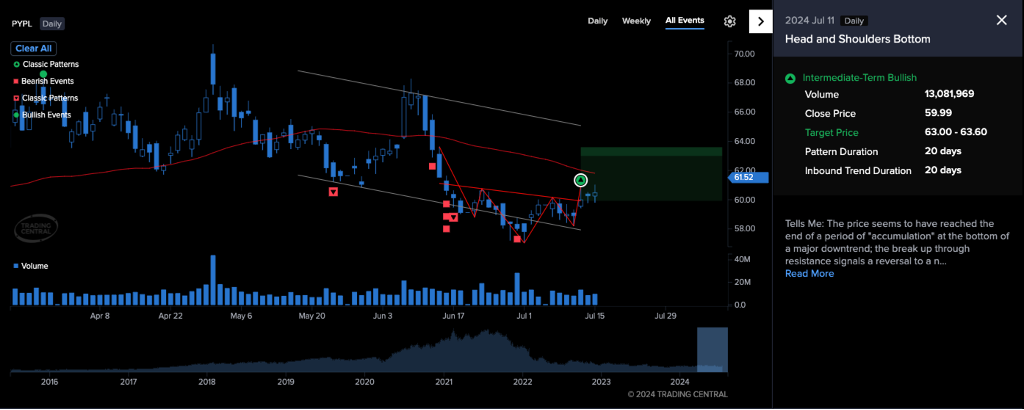
Investors study recurring patterns in price charts that indicate potential reversals or continuations of trends. Patterns like head and shoulders, double tops or bottoms, flags, and pennants often accompany shifts in momentum. Recognizing these patterns helps investors anticipate future price movements and manage risk accordingly.
You notice if drill down on a particular chart on the right side there is a text area that spells out what this pattern is showing. Just click Read More to see more details.
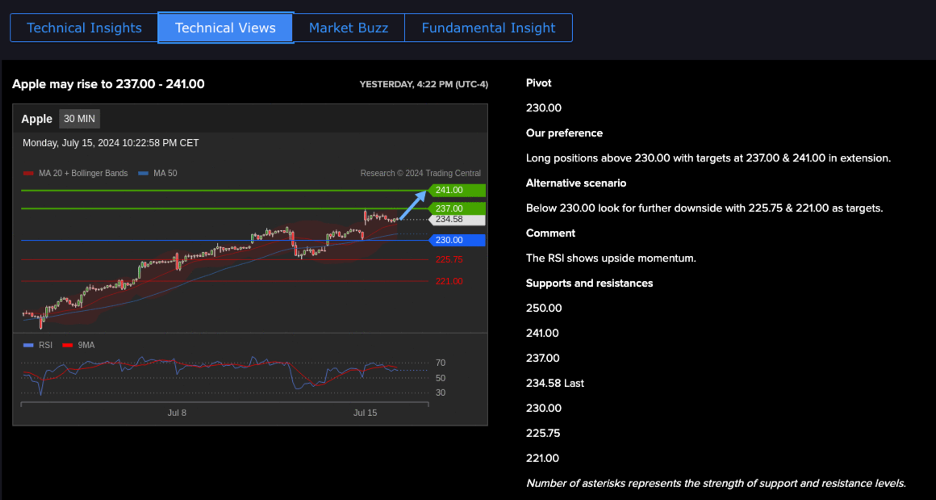
These levels are price points where a stock tends to find barriers (resistance) or support during uptrends or downtrends. Breakouts above resistance or breakdowns below support levels can indicate changes in momentum. Technical analysts use these levels to set entry and exit points for trades and to gauge the strength of prevailing trends.
Oscillators are based on mathematical formulas that incorporate historical or recent prices of the stock.
Oscillators such as the RSI and Stochastic help identify overbought or oversold conditions, which can signal potential reversals in momentum. These indicators measure the velocity and magnitude of price movements within predetermined ranges, offering insights into market sentiment and momentum shifts.
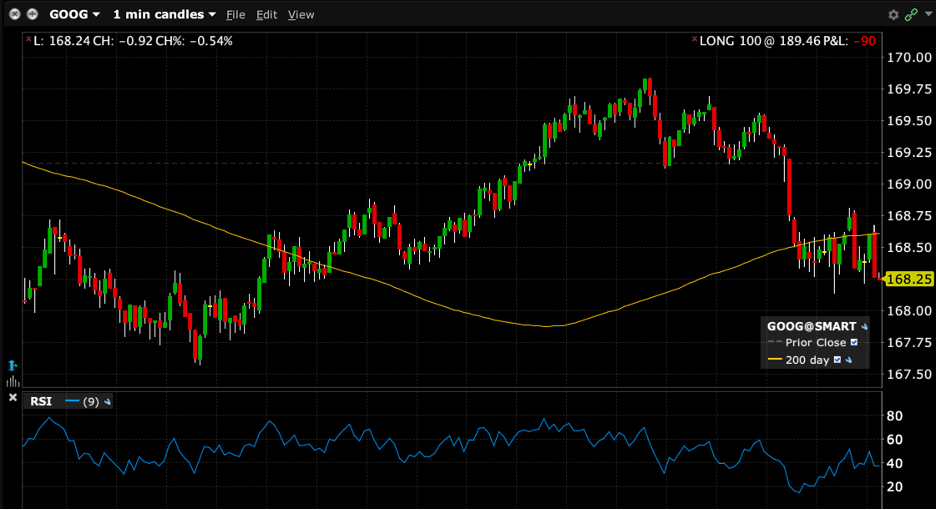
The RSI oscillates between zero and 100. Traditionally the RSI is considered overbought when above 70 and oversold when below 30. Signals can be generated by looking for divergences and failure swings. So, RSI can also be used to identify the general trend.
And always review Volume levels, the number of shares traded over a specific period, which is another crucial indicator of momentum. Increasing volume during price advances or declines can confirm the strength of a trend.
Volume-based indicators like On-Balance Volume (OBV) analyze whether volume is flowing into or out of a security, providing insights into buying or selling pressure and confirming momentum trends.
Overall, technical analysis provides a systematic approach to understand and interpret price movements and momentum in stocks. By analyzing historical price data and patterns, investors aim to predict future price movements, identify optimal entry and exit points, and manage risk effectively.
While technical analysis has its critics and limitations, particularly concerning its reliance on historical data and the assumption of market efficiency, many investors find it a valuable tool for making trading decisions in various financial markets.
The analysis in this material is provided for information only and is not and should not be construed as an offer to sell or the solicitation of an offer to buy any security. To the extent that this material discusses general market activity, industry or sector trends or other broad-based economic or political conditions, it should not be construed as research or investment advice. To the extent that it includes references to specific securities, commodities, currencies, or other instruments, those references do not constitute a recommendation by IBKR to buy, sell or hold such investments. This material does not and is not intended to take into account the particular financial conditions, investment objectives or requirements of individual customers. Before acting on this material, you should consider whether it is suitable for your particular circumstances and, as necessary, seek professional advice.
The views and opinions expressed herein are those of the author and do not necessarily reflect the views of Interactive Brokers, its affiliates, or its employees.
Any stock, options or futures symbols displayed are for illustrative purposes only and are not intended to portray recommendations.


Join The Conversation
For specific platform feedback and suggestions, please submit it directly to our team using these instructions.
If you have an account-specific question or concern, please reach out to Client Services.
We encourage you to look through our FAQs before posting. Your question may already be covered!