
- Solve real problems with our hands-on interface
- Progress from basic puts and calls to advanced strategies
Interactive Options Course
Lesson 4 of 6
New to Interactive Brokers?
Trend followers follow daily or weekly momentum indicators. Short-term traders may still find the same indicators powerful, but they are two very different forms of trading and investing.
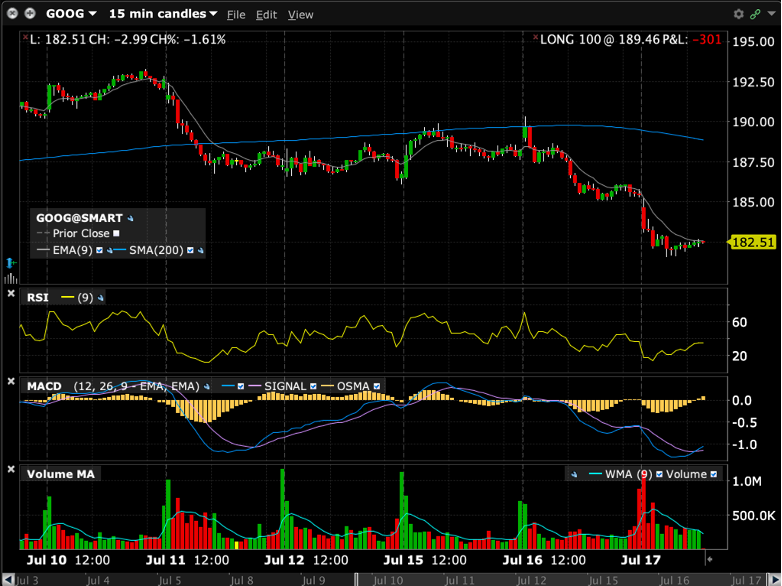
The Moving Average Convergence Divergence (MACD) is a versatile and widely used technical indicator that helps investors identify trends, momentum shifts, and potential entry or exit points in financial markets.
MACD consists of three primary components:
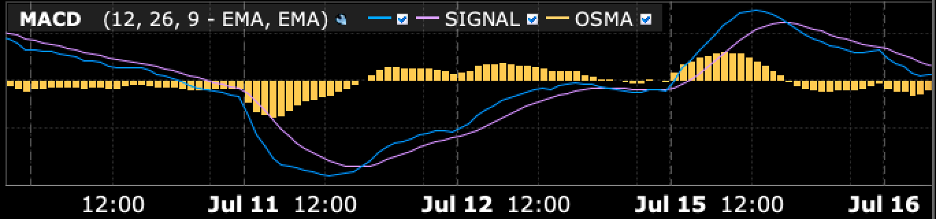
Example Using Daily Chart
When the blue line crosses the purple line, the histogram value becomes positive and is read as a buy signal. Conversely, when the histogram display is negative, the purple line has crossed below the blue line turning momentum negative, constituting a sell signal.
purple line has crossed below the blue line turning momentum negative, constituting a sell signal.
Investors may view this as a signal to sell or take profits, especially if other indicators confirm a weakening trend.
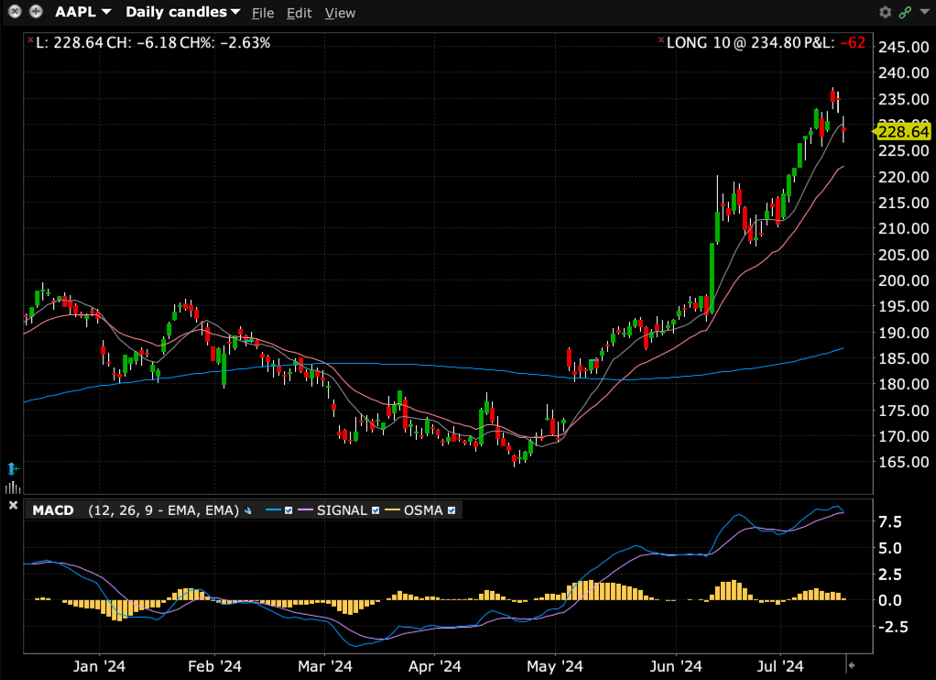
Understanding the Zero Line
The Zero Line on the MACD indicator is crucial for interpreting trend strength.
When the MACD line is above the zero line, it indicates that the short-term EMA is above the long-term EMA, signaling bullish momentum.
Conversely, when the MACD line is below the zero line, the short-term EMA is below the long-term EMA, indicating bearish momentum.
MACD is often used in conjunction with other technical indicators to confirm signals and improve trading accuracy:
Wait for MACD crossovers to be confirmed by other indicators or market conditions before making trading decisions. Another signal that traders look for is a divergence from price. The MACD line should move up and down with the trend of price and if it starts to diverge, that might indicate a change in the trend of price.
Divergence occurs when the price of an asset moves in the opposite direction of a technical indicator, such as the MACD. It suggests a potential change in momentum and often precedes a reversal or significant correction in price. Let’s delve into the concept of divergence with an example using the MACD indicator.
Divergence occurs in two primary forms:
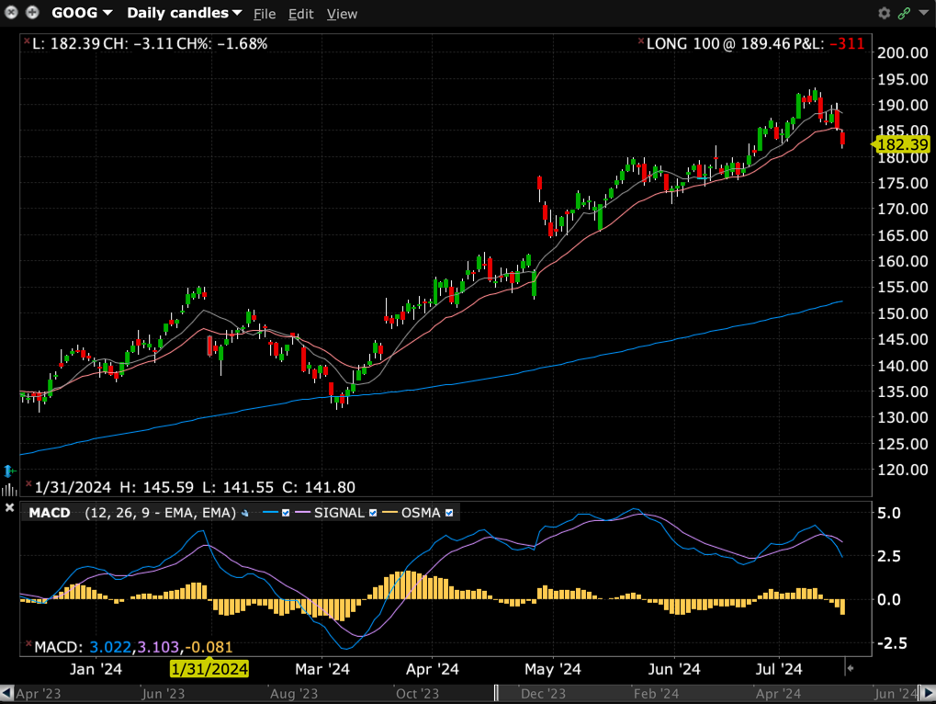
Regular bullish divergence forms when the price of an asset forms a lower low, but the MACD indicator forms a higher low. This indicates that while the price is showing weakening downward momentum, the MACD is suggesting that bullish momentum might be building.
This discrepancy suggests that selling pressure is decreasing, and a potential reversal or upward movement could be imminent.
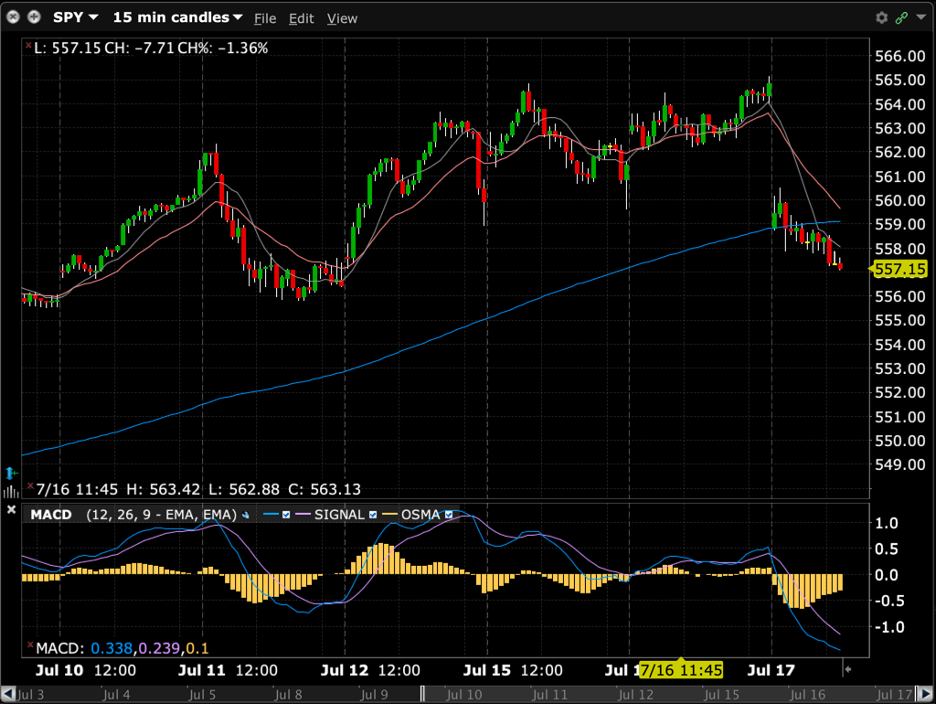
Regular bearish divergence forms when the price of an asset forms a higher high, but the MACD indicator forms a lower high. This indicates that while the price is reaching higher peaks, the momentum indicated by the MACD is weakening.
This divergence suggests that buying momentum may be waning, and a potential reversal or downward movement could follow.
Both divergences are most significant when they occur at relatively overbought/oversold levels.
Investors often use divergence alongside other technical indicators and fundamental analysis to confirm signals and strengthen their trading decisions. It can help traders anticipate trend reversals, avoid false signals, and better time entry and exit points in the market.
As with any technical analysis tool, it’s essential to combine divergence signals with other forms of analysis and risk management strategies to maximize its effectiveness in trading decisions.
MACD’s versatility make it a cornerstone of technical analysis, offering investors a powerful tool for navigating the complexities of financial markets.
For specific platform feedback and suggestions, please submit it directly to our team using these instructions.
If you have an account-specific question or concern, please reach out to Client Services.
We encourage you to look through our FAQs before posting. Your question may already be covered!
The analysis in this material is provided for information only and is not and should not be construed as an offer to sell or the solicitation of an offer to buy any security. To the extent that this material discusses general market activity, industry or sector trends or other broad-based economic or political conditions, it should not be construed as research or investment advice. To the extent that it includes references to specific securities, commodities, currencies, or other instruments, those references do not constitute a recommendation by IBKR to buy, sell or hold such investments. This material does not and is not intended to take into account the particular financial conditions, investment objectives or requirements of individual customers. Before acting on this material, you should consider whether it is suitable for your particular circumstances and, as necessary, seek professional advice.
The views and opinions expressed herein are those of the author and do not necessarily reflect the views of Interactive Brokers, its affiliates, or its employees.
Any stock, options or futures symbols displayed are for illustrative purposes only and are not intended to portray recommendations.


In the macd histogram, both positive and negative portions of the histogram are of the same colours. It will help if they are of different colours, and the settings does not seem to allow different colours in the histogram for positive and negative portion. Please help…
Right-click > Settings > Style > Histogram
Hi, thank you for asking. In TWS, the positive and negative are not the same colors. Also you can configure the colors in the settings panel in the top right hand corner for the Body, Borders, and Wick. We hope this helps!
It only allow for 1 colour for the histogram despite positive or negative. I don’t see any setting that toggle the positive/negative colour separately. Please specify. Thanks!
В наши дни интернет является неотъемлемой частью нашей повседневности.
Он даёт быстрый возможность доступа к огромному объёму информации.
За счёт всемирной паутине мы можем взаимодействовать с друзьями и партнёрами в любой точке мира.
В сфере работы, учёбы и бизнеса интернет превратилась в главный инструмент.
https://in4media.ru/
Помимо этого, интернет предоставляет неисчерпаемые варианты для отдыха и личностного роста.
При отсутствии интернета в современном мире сложно представить как домашние, так и рабочие задачи.
Поэтому наличие к качественному сетевому соединению считается базовой необходимостью современного человека.