
- Solve real problems with our hands-on interface
- Progress from basic puts and calls to advanced strategies
Interactive Options Course

Posted July 31, 2026 at 11:45 am
Seasonality in financial markets refers to recurring patterns that tend to emerge during specific periods of the year, influenced by economic cycles, investor behavior, and market dynamics.
Tracking these recurring patterns allows us to anticipate shifts and position ourselves strategically. This comprehensive overview of seasonality will explore its core mechanics and demonstrate how historical data can highlight the most favorable periods for analyzing an index, a stock, a commodity, or any other asset. The objective is to provide a practical framework for reading these cyclical variations and leveraging them effectively.
At its core, seasonality refers to a regular, cyclical variation observed within a historical data series. These fluctuations occur at periodic intervals, often following a highly specific pattern. Nature provides an excellent baseline for this concept through shifting temperatures throughout the year: spring blossoming into summer, transitioning into autumn, and eventually leading to the chill of winter in a perpetual cycle.
If we look at the temperature in New York City, a clear example of seasonality emerges. We find a recurring pattern where the low temperatures of the winter period systematically alternate with the higher temperatures of the summer period. Naturally, this does not exclude anomalies—there may be unusually warm days in winter or unseasonably cold days in summer. However, thanks to seasonality, we gain a probabilistic advantage: if you had to guess when a cold day might strike in New York City, you would undoubtedly choose January, February, or December. In those months, the chances of experiencing a freezing day are significantly higher than in June, July, or August.
This phenomenon, deeply embedded in the natural world, is equally powerful in the complex realm of financial instruments. Seasonality allows us to decipher past data to predict whether an upward or downward movement is more likely to occur for a particular asset during a specific timeframe.
A crucial point to understand is that seasonality impacts every financial asset. It can be successfully applied to commodities, indices, Forex, cryptocurrencies, and it proves exceptionally powerful on individual stocks (for instance, Nvidia responds remarkably well to these metrics).
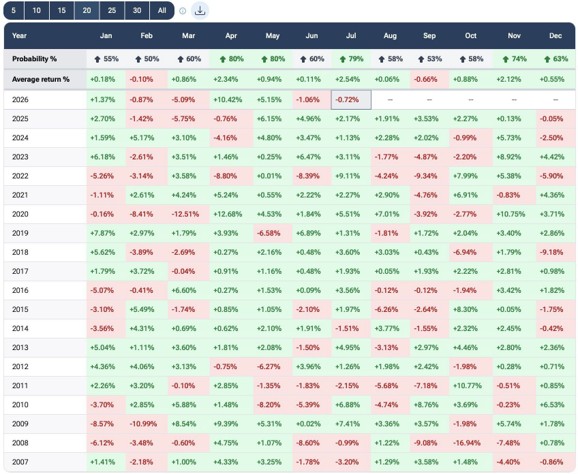
By accessing the Forecaster software and navigating to the Seasonality page, you are presented with a detailed table displaying raw seasonality. This layout breaks down performance month by month for every single year, allowing you to look back up to 30 years. Analyzing Seasonality for the S&P 500 over a 20-year horizon, we can see that July is historically a very favorable month: it has closed positively in 80% of cases, generating an average return of +2.64%.
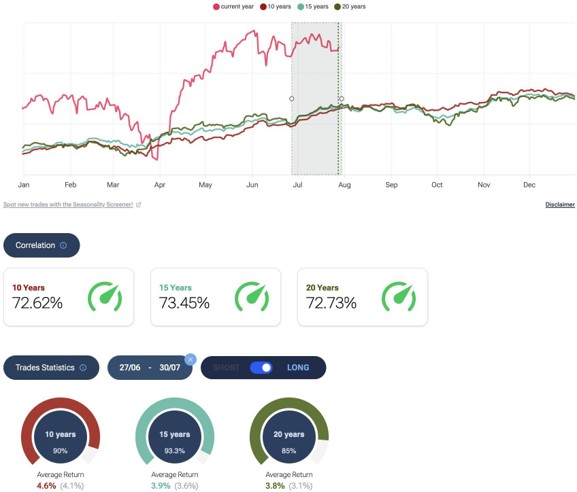
The analytical potential expands significantly when observing the seasonality chart, where Forecaster automatically plots the current year’s trajectory over historical data. Users can easily toggle different metrics on the screen, deactivating less correlated curves to focus on specific intervals like 10-year, 15-year, or 20-year seasonality. The construction of this chart is straightforward: for the 10-year S&P 500 seasonality, the software aggregates the ten previous annual charts (from January 1st to December 31st) and calculates the exact average.
This process reveals illuminating behavioral patterns. For example, by examining the 10-year average on the S&P 500 from February to the end of March, we can highlight a distinct trend. If we query the system about a short trade during this specific window, we find it was profitable 40% of the time with an average return of 12%. Conversely, a long trade in the same period had a 60% win rate but only yielded a 3.3% return. Visually, the chart confirms that downward movements during this phase, while slightly less frequent, carry a much heavier impact than upward ones.
The real competitive edge comes from comparing current price action to historical tendencies. Right now, the S&P 500 is moving with a very high correlation to its 10-year and 20-year seasonality averages. When analyzing the month of July across different historical windows, the data is incredibly strong:
Past 10 years: 90% of the years were positive, with an average return of 4.7%. Past 15 years: The winning ratio rises to 93%, with an average return of 3.7%. Past 20 years: We observe a 90% win rate and a 3.6% average return.
These robust numbers indicate that we are entering a period that has historically been extremely strong, offering a solid statistical advantage to those who know how to read the data.
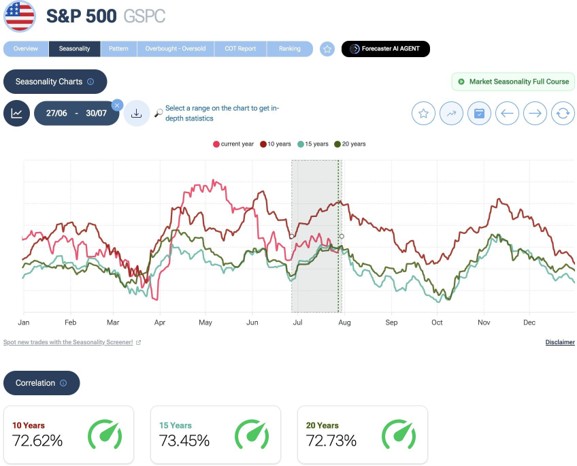
Another outstanding feature is the detrended version of the seasonality. By applying this filter, the software removes the dominant macro trend from the chart, isolating the pure cyclical component. This is heavily utilized for identifying potential market lows. Historically speaking, the very beginning of July is a period where the S&P 500 tends to form an important low. This is followed by a positive phase, which eventually switches to a potential negative period starting from early August until the beginning of October.
What is truly remarkable is that plotting the 10-year and 20-year seasonality yields almost identical movements. This consistency proves that seasonality is a structural reality, not a coincidence.
Forecaster’s data granularity even extends to daily averages. For instance, the first day of July has been positive in 86% of cases over the past 10 and 20 years, and 91% of cases over the past 15 years. If markets open in negative territory on such a day (as seen on platforms like Yahoo Finance), historical statistics suggest it could be an excellent opportunity for an intraday long trade.
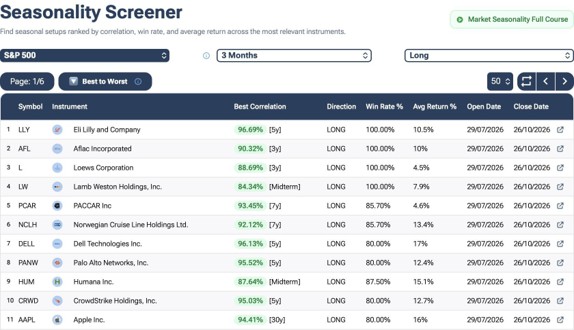
For those actively seeking setups, the tool area features the seasonality screener. In just three clicks, you can select your asset class (e.g., the S&P 500 basket), define your time frame (e.g., a 3-month window), and choose your direction (long only). The system instantly outputs a list of the best opportunities. A prime example generated by this search is Eli Lilly and Company: over the past 5 years, it has recorded a positive July in 100% of cases, with an average return of +10,5%.
Diving deeper into CF Industries Holdings, Forecaster reveals a fascinating statistic: the current year is moving with an 83% correlation to election years, which are directly tied to the American election cycle. Exploring this specific historical data, we find that in this exact time window, trades were positive in 100% of cases, boasting a staggering average return of 26%. Even if the correlation with standard 10 or 15-year curves isn’t perfectly aligned in this specific instance, the strict adherence to the mid-term cycle is enough to confirm a massive opportunity.
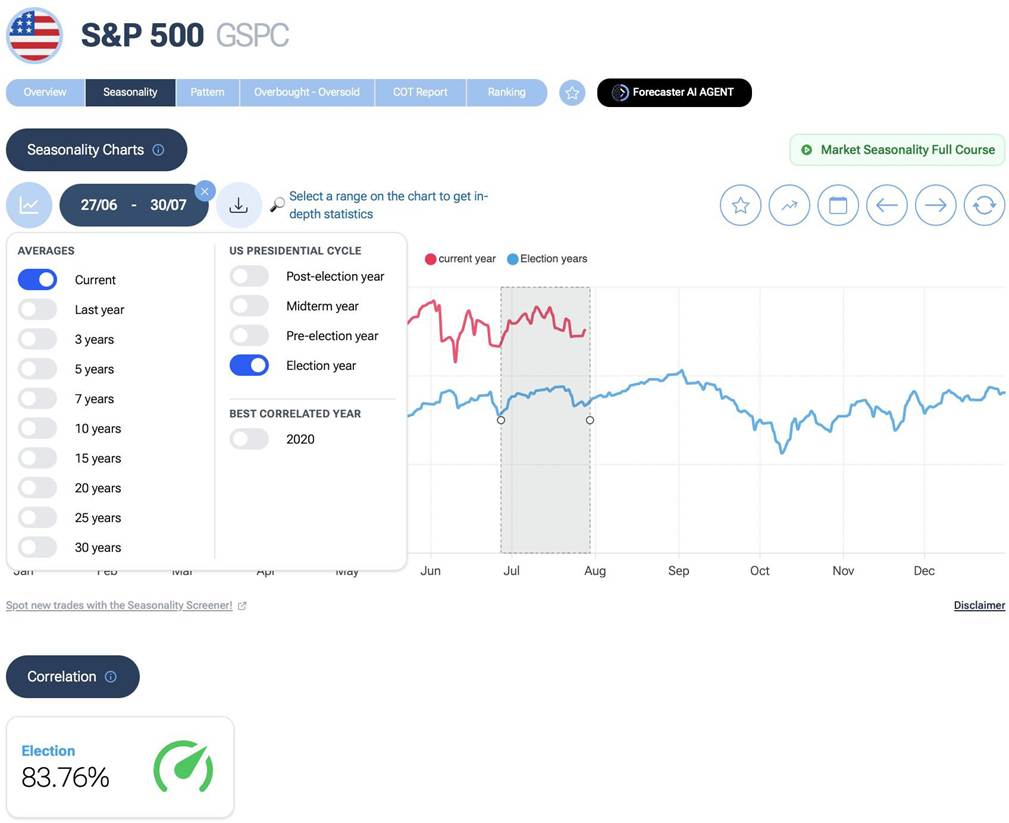
To maximize the effectiveness of this data, seasonality should be combined with other analytical methods. Anyone looking to deepen their understanding can visit the seasonality section on the forecaster.biz website. There, you can find abundant information on how to integrate these quantitative insights with traditional technical analysis, trend lines, and market indicators, giving you the ultimate edge to navigate the financial landscape.
—
Originally Posted July 29, 2026
Information posted on IBKR Campus that is provided by third-parties does NOT constitute a recommendation that you should contract for the services of that third party. Third-party participants who contribute to IBKR Campus are independent of Interactive Brokers and Interactive Brokers does not make any representations or warranties concerning the services offered, their past or future performance, or the accuracy of the information provided by the third party. Past performance is no guarantee of future results.
This material is from Forecaster.biz and is being posted with its permission. The views expressed in this material are solely those of the author and/or Forecaster.biz and Interactive Brokers is not endorsing or recommending any investment or trading discussed in the material. This material is not and should not be construed as an offer to buy or sell any security. It should not be construed as research or investment advice or a recommendation to buy, sell or hold any security or commodity. This material does not and is not intended to take into account the particular financial conditions, investment objectives or requirements of individual customers. Before acting on this material, you should consider whether it is suitable for your particular circumstances and, as necessary, seek professional advice.
Short selling is an advanced trading strategy involving potentially unlimited risks and must be done in a margin account.
Trading on margin is only for experienced investors with high risk tolerance. You may lose more than your initial investment. For additional information regarding margin loan rates, see ibkr.com/interest
Day Trading can be extremely risky and may not be appropriate for individuals with limited resources, investment experience or low risk tolerance. Please review the Day Trading Risk Disclosure Statement before deciding whether Day Trading is appropriate for you.
There is a substantial risk of loss in foreign exchange trading. The settlement date of foreign exchange trades can vary due to time zone differences and bank holidays. When trading across foreign exchange markets, this may necessitate borrowing funds to settle foreign exchange trades. The interest rate on borrowed funds must be considered when computing the cost of trades across multiple markets.
Futures are not suitable for all investors. The amount you may lose may be greater than your initial investment. Before trading futures, please read the CFTC Risk Disclosure. A copy and additional information are available at ibkr.com.
Trading in digital assets, including cryptocurrencies, is especially risky and is only for individuals with a high risk tolerance and the financial ability to sustain losses. Eligibility to trade in digital asset products may vary based on jurisdiction.
Spot currencies are not available at IBKR Singapore.
Related Articles


















Join The Conversation
For specific platform feedback and suggestions, please submit it directly to our team using these instructions.
If you have an account-specific question or concern, please reach out to Client Services.
We encourage you to look through our FAQs before posting. Your question may already be covered!