
- Solve real problems with our hands-on interface
- Progress from basic puts and calls to advanced strategies
Interactive Options Course

Posted June 17, 2026 at 12:00 pm
Whenever equity markets approach record highs, the word “bubble” quickly returns to the financial debate.
The concern is understandable. The S&P 500 has delivered substantial gains, valuations in some areas appear elevated, and a relatively small group of mega-cap companies accounts for a considerable portion of the index.
However, strong price performance alone is not sufficient to identify a speculative bubble. To assess whether market prices have become disconnected from economic reality, investors should examine several dimensions: corporate revenues, earnings, cash-flow generation, market concentration, estimated valuations and institutional positioning.
Looking at these indicators together produces a more nuanced picture than simply comparing the index with its previous highs.
Over long periods, equity prices tend to be influenced by the ability of companies to increase revenues, generate profits and produce cash flows for shareholders.
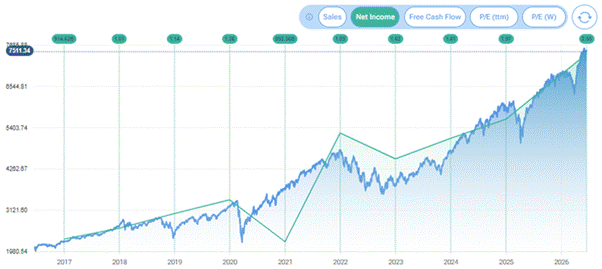
Using the Forecaster Terminal, it is possible to compare the historical performance of the S&P 500 with the aggregate sales and net income of its constituent companies.
The comparison highlights an important point: although the index has appreciated considerably, the advance has not occurred in complete isolation from corporate fundamentals. Aggregate revenues and earnings have also expanded over time.
This does not mean that the index is necessarily inexpensive, nor does it guarantee that prices will continue rising. It does, however, suggest that at least part of the market’s performance has been supported by growth in the underlying businesses.
Source: Forecaster.biz
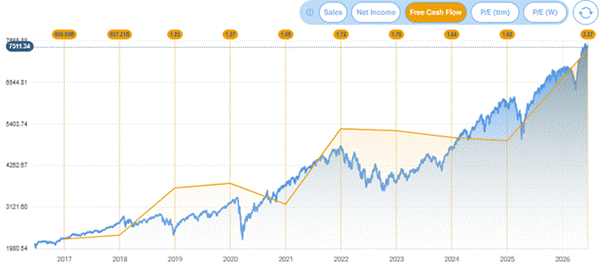
Free cash flow provides another useful perspective. Unlike accounting earnings, free cash flow attempts to measure the cash generated by a business after accounting for the capital expenditure required to maintain or expand its operations.
The aggregate free-cash-flow chart available in the Forecaster Terminal (image below ) can therefore help investors assess whether earnings growth is translating into actual cash generation.
Source: Forecaster.biz
Recent strength in aggregate free cash flow would indicate that many large US companies continue to possess meaningful financial flexibility. Cash flow may be used for investments, acquisitions, debt reduction, dividends or share repurchases.
Nevertheless, aggregate figures should be interpreted carefully. Strong results from a relatively small number of highly profitable companies can significantly influence the overall index data.
One of the strongest arguments supporting the bubble narrative is the concentration of the S&P 500.
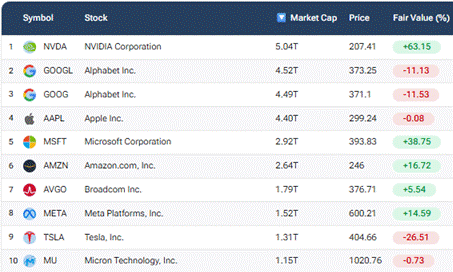
Because the index is weighted by market capitalisation, its largest companies have a disproportionate influence on its performance. A strong advance by a limited number of mega-cap businesses can therefore push the entire index higher, even when the performance of the average constituent is considerably weaker.
Investors can use the S&P 500 company ranking in the Forecaster Terminal to examine the difference in size between the largest index members and the companies positioned near the bottom of the ranking.
Source: Forecaster.biz
Concentration is not necessarily proof of a bubble. The largest companies may deserve premium valuations because they possess stronger margins, dominant competitive positions, recurring revenue, high returns on capital or superior growth prospects.
However, concentration can increase portfolio risk. When a small group of companies accounts for a large share of index performance, disappointing earnings or lower valuation multiples for those companies could have an outsized effect on the broader market.
For this reason, investors should distinguish between the valuation of the index and the valuation of the individual businesses within it.
Valuation is more complex than comparing the current price with a single historical ratio.
Different models produce different results because they rely on assumptions regarding future growth, profitability, interest rates, risk premiums and terminal values. No valuation model can calculate an objectively correct price.
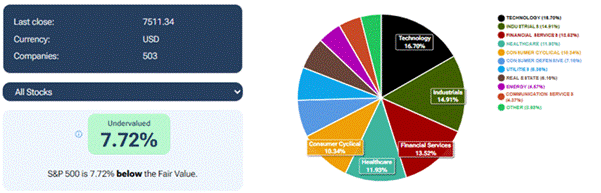
Forecaster estimates the fair value of individual companies through multiple valuation methodologies. These estimates can then be aggregated to provide an indication of the potential valuation of the overall index.
At the time of this analysis, the aggregate S&P 500 fair-value model indicated that the index was trading below the model’s central estimate by approximately 7.72% (see the image below)
This result should not be interpreted as a forecast or a recommendation to purchase the index. It is better viewed as one scenario derived from a defined set of financial assumptions.
Source: Forecaster.biz
An index trading below an estimated fair value may still decline further. Earnings forecasts can be revised, discount rates can rise and economic conditions can deteriorate. Conversely, an index trading above estimated fair value can remain expensive for an extended period.
Valuation may help investors evaluate potential long-term risk and reward, but it is generally less reliable as a short-term timing instrument.
Fundamental analysis can be complemented by positioning data.
The Commitment of Traders report, published by the US Commodity Futures Trading Commission, provides information about the positions held by different categories of participants in futures markets.
For equity indices, the positioning of asset managers can be particularly interesting because these participants may include pension funds, institutional portfolios and other professionally managed investment vehicles.
Through the S&P 500 Commitment of Traders analysis, investors can compare changes in asset-manager positioning with movements in the underlying index.
During a previous market decline, for example, S&P 500 prices recorded a lower low while asset-manager net positioning did not decline to a corresponding lower low (see image below). This created a positive divergence between prices and positioning.
Such a divergence can suggest that professional participants are becoming less defensive as prices fall. It should not, however, be treated as an automatic market-bottom signal.

Source: Forecaster.biz
It is also important to recognise the limitations of the data. COT figures are published with a delay, futures positions may be used for hedging, and an institution’s futures exposure may represent only one component of a much larger portfolio.
The information is therefore most useful when incorporated into a wider analytical framework rather than used in isolation.
The ability to overlay S&P 500 prices with asset-manager positioning makes it easier to identify periods in which the two series confirm or contradict each other.
When prices and institutional net positions rise together, the market trend may be receiving confirmation from positioning data. When prices rise but asset managers consistently reduce their net exposure, the divergence may deserve closer attention.
A similar pattern appeared before a previous market correction: the index continued advancing while asset-manager net positions weakened. That divergence did not determine the exact timing of the reversal, but it provided an early indication that institutional participation was becoming less supportive.
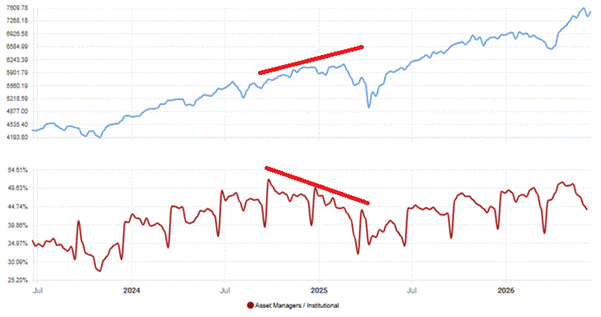
Source: Forecaster.biz
More recently, price and positioning trends have appeared more aligned, although the situation can change rapidly. Investors should therefore monitor whether future market weakness is accompanied by renewed institutional accumulation or by continued reductions in exposure.
A final perspective comes from historical seasonality.
The current period is historically one of the most constructive phases of the year for the S&P 500. According to the S&P 500 seasonality analysis available in the Forecaster Terminal, June has produced a positive return in 89% of the years included in the selected sample, with an average return of approximately 2.05%.
The seasonal pattern becomes even stronger in July, which recorded positive performance in 100% of the observations and an average gain of 3.35%, while August remained positive in 67% of cases, with an average return of 1.04%.
Taken together, these figures suggest that the June-to-August period has historically provided a relatively favourable backdrop for US equities. However, seasonality describes an average historical tendency rather than a forecast: the current year can deviate substantially from the pattern, as shown by June 2026, which was still negative at the time the data was captured.
The available evidence does not lead to a simple yes-or-no conclusion.
The S&P 500 presents some characteristics commonly associated with elevated market risk:
At the same time, aggregate revenues, net income and free cash flow suggest that the market advance has not been driven exclusively by speculative expectations.
Fair-value estimates may also indicate that the index is not uniformly overvalued, although these models depend heavily on their underlying assumptions. Institutional positioning and seasonal data provide additional context but cannot reliably predict short-term market movements.
The most reasonable conclusion is therefore that “bubble” may be too simplistic a description.
Parts of the market may be expensively valued, while other companies or sectors may trade closer to—or below—reasonable fundamental estimates. The index can simultaneously contain highly valued securities, financially strong businesses and less popular companies with very different risk-and-return profiles.
Rather than attempting to classify the entire market with a single label, investors may benefit from monitoring multiple indicators and evaluating how the evidence changes over time.
A market supported by fundamentals can still experience a significant correction. Equally, a market that appears expensive can continue advancing when earnings growth remains strong.
The objective of a multi-factor framework is not to predict the next market move with certainty. It is to replace emotionally charged narratives with a more disciplined examination of fundamentals, valuation, positioning and historical behaviour.
The author is affiliated with Forecaster Terminal. References and links to the platform are included for illustrative and educational purposes.
This material is provided for informational and educational purposes only and does not constitute investment advice, a recommendation, an offer to buy or sell any financial instrument, or a solicitation of any investment strategy. Valuation estimates, historical relationships, positioning data and seasonal patterns are subject to limitations and may not be repeated in the future. Past performance is not indicative of future results. Investors should conduct their own research and consider their objectives, financial circumstances and risk tolerance before making investment decisions.
Information posted on IBKR Campus that is provided by third-parties does NOT constitute a recommendation that you should contract for the services of that third party. Third-party participants who contribute to IBKR Campus are independent of Interactive Brokers and Interactive Brokers does not make any representations or warranties concerning the services offered, their past or future performance, or the accuracy of the information provided by the third party. Past performance is no guarantee of future results.
This material is from Forecaster.biz and is being posted with its permission. The views expressed in this material are solely those of the author and/or Forecaster.biz and Interactive Brokers is not endorsing or recommending any investment or trading discussed in the material. This material is not and should not be construed as an offer to buy or sell any security. It should not be construed as research or investment advice or a recommendation to buy, sell or hold any security or commodity. This material does not and is not intended to take into account the particular financial conditions, investment objectives or requirements of individual customers. Before acting on this material, you should consider whether it is suitable for your particular circumstances and, as necessary, seek professional advice.
Security futures involve a high degree of risk and are not suitable for all investors. The amount you may lose may be greater than your initial investment. Before trading security futures, please read the Security Futures Risk Disclosure Statement. For a copy visit ibkr.com
Futures are not suitable for all investors. The amount you may lose may be greater than your initial investment. Before trading futures, please read the CFTC Risk Disclosure. A copy and additional information are available at ibkr.com.
Related Articles


















Join The Conversation
For specific platform feedback and suggestions, please submit it directly to our team using these instructions.
If you have an account-specific question or concern, please reach out to Client Services.
We encourage you to look through our FAQs before posting. Your question may already be covered!