
- Solve real problems with our hands-on interface
- Progress from basic puts and calls to advanced strategies
Interactive Options Course

Posted February 25, 2025 at 12:46 pm
This morning is the latest in a dreary streak. For weeks, we have been writing about the weakening states of consumer sentiment and spending, and this morning we received yet another dismaying piece of data that reaffirmed those concerns. Today’s blow came from the Conference Board, which arrived yet another attempted early market rally petered out.
Quite frankly, the Conference Board Consumer Confidence and Expectations reports for February stunk. Consumer Confidence fell to 98.3 from last month’s 105.3 (revised up from 104.1). The consensus estimate was a modest drop to 102.5, not a plunge. Simultaneously, Expectations showed an even bigger drop, falling to 72.9 from 82.2 (revised down from 83.9). There is no published consensus estimate for that figure, but it is quite difficult to imagine that it would have projected such a stunning decline.
Once again stocks acted accordingly after the report, with the S&P 500 (SPX) falling as much as -1.2% and the Nasdaq 100 (NDX) dropping as much as -2%. At the same time, Treasury yields are 8-10bp lower across the curve. It is always difficult to unpack whether a drop in yields on a down day for stocks represents economic concerns or a flight to safety, though today’s dip in yields seems to have elements of both.
Rate cut expectations have been rising, with Fed Funds futures now pricing in a cut by July, a second in October, and a 40% chance for another in December. One month ago, a cut was also priced in for July, with a 68% chance of a further cut by the end of the year. The change reflects the souring economic mood.
Yet there is also a palpable “risk-off” to markets as well. Besides the aforementioned drop in stocks, we were already seeing a significant drop in bitcoin. The cryptocurrency was trading below $90,000 even as stocks were modestly unchanged in the pre-market and touched $86,000 when stocks were at their morning lows. So much for it being a diversifying asset, at least right now.
Despite all of the above, markets are not necessarily as rotten as they seem. NYSE decliners are only slightly outpacing advancers, and the same is true for SPX. The selling is more about a rotation out of technology and other high-beta growth stocks into lower-beta value stocks. However, the fact that major cap-weighted indices like SPX and NDX are top-heavy with megacap tech names makes them more susceptible when money aggressively flows out of that sector. Weak overseas sales are weighing heavily on Tesla (TSLA), while Meta Platforms (META) is responding to its recent 20-day win streak with what is now its 6th straight day of declines. Even worse, that stock has given back all that it gained during the three-week period form January 27th through its all-time high on February 14th – literally about a month’s worth of gains!
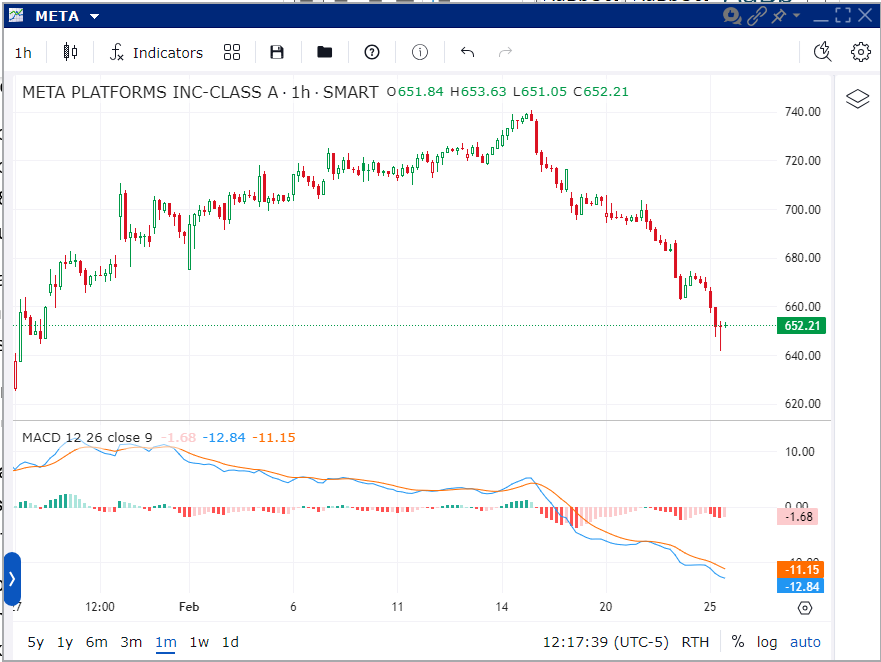
Source: Interactive Brokers
Re NVDA: While I normally post something about major post-close earnings on the morning of the report, I will be unable to publish tomorrow. So, here is a quick note about NVDA. These earnings are critical because that company remains the poster child for AI – specifically the pre-DeepSeek AI model that requires huge investments in data centers, chips, and power. Any sign of weakness, or even that the pace of growth is likely to slow, will be problematic. On the other hand, the stock hasn’t done much over the past few months, perhaps meaning that it is less susceptible to a downside surprise. Options markets are pricing in some risk aversion via relatively steep skew and an 8.4% daily at-money volatility. Interestingly, the stock hasn’t been all that volatile after recent earnings, with the last 6 post-earnings moves being +0.53%, -6.38%, +9.32%, +16.4%, -2.46% and +0.1% (avg 5.87%). Meanwhile the IBKR Probability Lab shows a fairly symmetrical distribution for options expiring Friday, we do see a relatively pronounced downward skew:
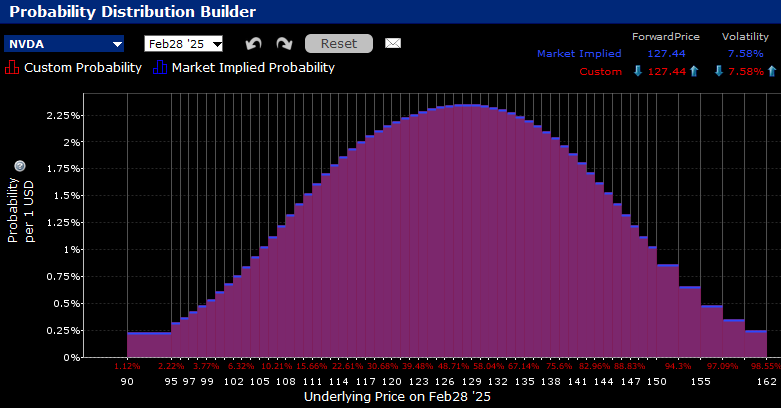
Source: Interactive Brokers
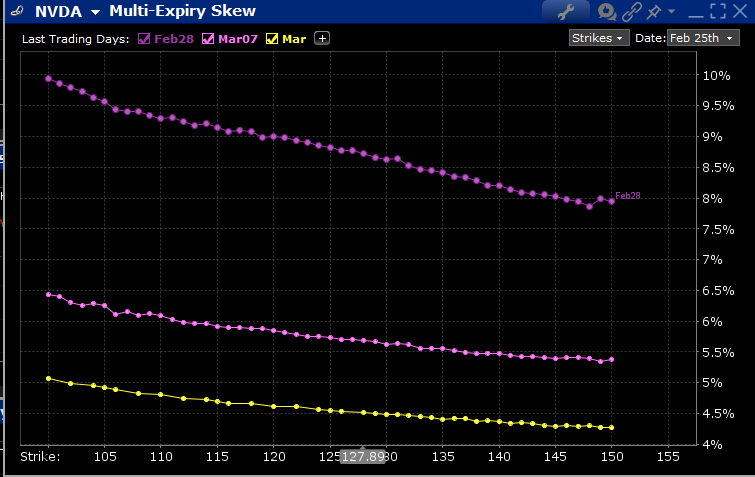
Source: Interactive Brokers
The analysis in this material is provided for information only and is not and should not be construed as an offer to sell or the solicitation of an offer to buy any security. To the extent that this material discusses general market activity, industry or sector trends or other broad-based economic or political conditions, it should not be construed as research or investment advice. To the extent that it includes references to specific securities, commodities, currencies, or other instruments, those references do not constitute a recommendation by IBKR to buy, sell or hold such investments. This material does not and is not intended to take into account the particular financial conditions, investment objectives or requirements of individual customers. Before acting on this material, you should consider whether it is suitable for your particular circumstances and, as necessary, seek professional advice.
The views and opinions expressed herein are those of the author and do not necessarily reflect the views of Interactive Brokers, its affiliates, or its employees.
The projections or other information generated by the Probability Lab tool regarding the likelihood of various investment outcomes are hypothetical in nature, do not reflect actual investment results and are not guarantees of future results. Please note that results may vary with use of the tool over time.
Related Articles


Join The Conversation
For specific platform feedback and suggestions, please submit it directly to our team using these instructions.
If you have an account-specific question or concern, please reach out to Client Services.
We encourage you to look through our FAQs before posting. Your question may already be covered!