
- Solve real problems with our hands-on interface
- Progress from basic puts and calls to advanced strategies
Interactive Options Course
Posted August 21, 2024 at 10:45 am
The upcoming Federal Open Market Committee (FOMC) meeting, on 17-18 September 2024, is a hotly anticipated date in the financial world.
Many experts anticipate the Fed will hold rates steady at 5.25%-5.50%, waiting for inflation to cool further toward its 2% target. Nevertheless, recent market turbulence has also sparked speculation of a rate cut in September, possibly between 25 and 50 basis points. According to the latest Reuters Poll, on Monday August 19, fifty five out of one hundred and one analysts surveyed expect the Fed to cut rates by 75bps this year.
Before diving into further discussions, it’s essential to understand what the FOMC does.
The FOMC is a component of the Federal Reserve, the central bank of the United States. The committee is responsible for setting the federal funds rate, which is the interest rate at which banks lend to each other overnight. This rate is crucial because it influences all other interest rates in the economy, including those for mortgages, car loans, and savings accounts.
The FOMC meets eight times a year, roughly every six weeks, to review economic conditions and decide whether to raise, lower, or maintain the federal funds rate. These meetings are keenly awaited, and the decisions made have far-reaching effects on the economy and financial markets.
In this tense atmosphere, every data release and Fed statement is scrutinized.
But while most investors are looking intently at the central bank’s decision and what it signals, statistically, the relevant price movements occur in advance. And you can take advantage of them!
In a past Seasonal Insights, we highlighted the S&P 500’s average performance before and after the Fed’s meeting over the past 25 years.
That article concluded that in the two days leading up to the Fed’s second meeting day, the S&P 500 averaged a 0.36% rise. This may seem small at first glance. However, remember: calculated over the year, this corresponds to 66.55%! After all, the rise occurred in just two days.
As always information is power, and now you can access this powerful information with just a few clicks:
Source: Seasonax, sign up here https://app.seasonax.com/signup to access further analysis, 30 days for free
3. Select an event such as the FED meeting from the drop-down menu.
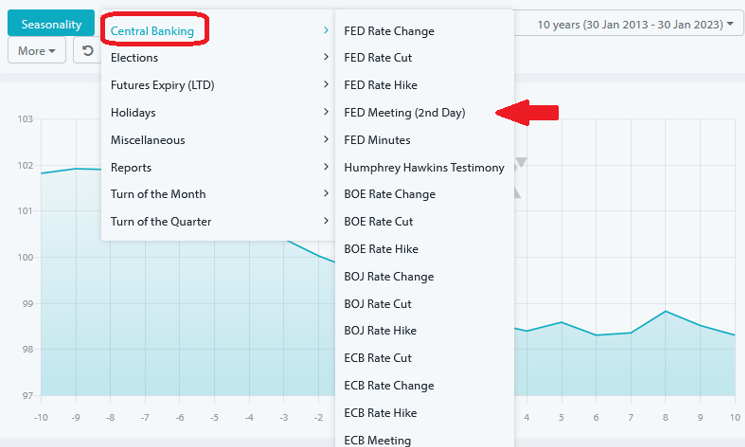
Source: Seasonax, sign up here https://app.seasonax.com/signup to access further analysis, 30 days for free
The event chart now shows you the average price trend of the instrument around the event. You can then select a start and end point to examine a pattern in more detail. This is analogous to the detailed pattern analysis you know from the seasonal chart. This includes various statistics, the cumulative profit curve and the distribution chart.
Of course, it is not only the FED meeting that has an influence on prices; many other events do so too.
This gives you a wide range of events to choose from: ranging from reports (such as the CPI or labor market data), to futures expiration days (like triple witching days), to calendar events.
One of the primary inputs into the FOMC’s decision-making process is economic data, including employment figures, inflation rates, and GDP growth. Significantly, many of these data points are subject to seasonal fluctuations. For example, retail sales often spike during the holiday season in November and December, while construction activity may slow down in the winter months due to harsh weather conditions.
To account for these fluctuations, economic data is often “seasonally adjusted.” This means that statistical techniques are used to remove the effects of seasonal patterns, allowing for a clearer comparison of data over time. However, even with these adjustments, the time of year can still influence the FOMC’s interpretation of the data. For instance, a weak jobs report in January might be viewed less critically if the FOMC considers the impact of post-holiday layoffs and winter weather.
Just as the FOMC’s decisions can be influenced by seasonality, so too can the market’s reactions. Investors are keenly aware of the potential for seasonal patterns in economic data and FOMC behavior. As a result, they may adjust their expectations and trading strategies based on the time of year.
For example, the stock market has historically shown a tendency to perform better in the final months of the year – a phenomenon known as the “Santa Claus rally.” This rally is often driven by investor optimism during the holiday season and the expectation that the FOMC will avoid making disruptive policy changes late in the year. Conversely, the summer months are sometimes marked by lower trading volumes and a greater focus on the FOMC’s mid-year meetings.
The latest data out of the US shows a ‘goldilocks scenario’. The economy is not too hot, not too cold, but just right. The latest CPI and PPI prints show a continued trend lower, the jobs market is weaker (but crucially not collapsing), and growth is remaining steady. This is a positive environment for US stocks and takes the pressure off the Fed to cut rates super quickly.
The latest NFP jobs print show the continued weakening of the labor market, but there is no need to panic like the markets did in early August. As long as inflation is cooling the Fed can cut rates and markets currently see a 77% chance of a 25bps September rate cut. Fed’s Powell should be cheering the latest falls in CPI at Jackson Hole this week and that could easily be a strong driver for stock gains into the end of this week.
As a trader, you can trade seasonal patterns directly. Alternatively, you can also use it as a filter: statistically speaking, as we saw in the FED meeting example, it is better not to go short on these two days.
If you have a longer-term view, use it to optimize your entry time: buy shares on the day before the FED meeting, and not immediately after the announcement of the meeting result.
Test it free for 30 days and explore patterns across various markets, including indices, (crypto)currencies, stocks, and commodities.
And remember: don’t just trade it, seasonax it!
—
Originally Posted August 21, 2024 – The Next Big Move: September FED Meeting
Past results and past seasonal patterns are no indication of future performance, in particular, future market trends. Seasonax GmbH neither recommends nor approves of any particular financial instrument, group of securities, segment of industry, analysis interval or any particular idea, approach, strategy or attitude nor provides consulting nor brokerage nor asset management services. Seasonax GmbH hereby excludes any explicit or implied trading recommendation, in particular, any promise, implication or guarantee that profits are earned and losses excluded, provided, however, that in case of doubt, these terms shall be interpreted in abroad sense. Any information provided by Seasonax GmbH or on this website or any other kind of data media shall not be construed as any kind of guarantee, warranty or representation, in particular as set forth in a prospectus. Any user is solely responsible for the results or the trading strategy that is created, developed or applied. Indicators, trading strategies and functions provided by seasonax GmbH or on this website or any other kind of data media may contain logical or other errors leading to unexpected results, faulty trading signals and/or substantial losses. Seasonax GmbH neither warrants nor guarantees the accuracy, completeness, quality, adequacy or content of the information provided by it or on this website or any other kind of data media. Any user is obligated to comply with any applicable capital market rules of the applicable jurisdiction. All published content and images on this website or any other kind of data media are protected by copyright. Any duplication, processing, distribution or any form of utilisation beyond the scope of copyright law shall require the prior written consent of the author or authors in question. Futures and forex trading contains substantial risk and is not for every investor. An investor could potentially lose all or more than the initial investment. Risk capital is money that can be lost without jeopardizing ones’ financial security or lifestyle. Only risk capital should be used for trading and only those with sufficient risk capital should consider trading. Past performance is not necessarily indicative of future results. Testimonials appearing on this website may not be representative of other clients or customers and is not a guarantee of future performance or success.
Information posted on IBKR Campus that is provided by third-parties does NOT constitute a recommendation that you should contract for the services of that third party. Third-party participants who contribute to IBKR Campus are independent of Interactive Brokers and Interactive Brokers does not make any representations or warranties concerning the services offered, their past or future performance, or the accuracy of the information provided by the third party. Past performance is no guarantee of future results.
This material is from Seasonax and is being posted with its permission. The views expressed in this material are solely those of the author and/or Seasonax and Interactive Brokers is not endorsing or recommending any investment or trading discussed in the material. This material is not and should not be construed as an offer to buy or sell any security. It should not be construed as research or investment advice or a recommendation to buy, sell or hold any security or commodity. This material does not and is not intended to take into account the particular financial conditions, investment objectives or requirements of individual customers. Before acting on this material, you should consider whether it is suitable for your particular circumstances and, as necessary, seek professional advice.
Related Articles


Join The Conversation
For specific platform feedback and suggestions, please submit it directly to our team using these instructions.
If you have an account-specific question or concern, please reach out to Client Services.
We encourage you to look through our FAQs before posting. Your question may already be covered!