
- Solve real problems with our hands-on interface
- Progress from basic puts and calls to advanced strategies
Interactive Options Course

Posted February 28, 2025 at 12:46 pm
In a sign that the risks of a slowing economy are increasingly being priced into equities, stocks are dead-cat bouncing today despite a PCE report depicting the sharpest contraction in inflation-adjusted consumption in roughly four years. But the print also sparked a reaction in the fixed-income complex, with yields tumbling to their lowest levels of 2025. Furthermore, today’s data is leading to rate watchers opening the door to a Fed reduction this summer and the June meeting now has a better chance than not of a quarter point cut from the central bank, according to our IBKR ForecastTrader prediction market. Under the hood of the data, meanwhile, inflationary pressures were largely as expected, but a sharp increase in goods costs led to consumers balking within the category. The resistance to higher charges signals that the capacity to maintain expenditure patterns may be stretched, as households face mounting anxiety over rising prices. In light of the contractionary economic figures we’ve been getting in the past few weeks, the Atlanta Fed’s popular GDP Now update forecasts a negative 1.5% pace for the first quarter.

Source: ForecastEx
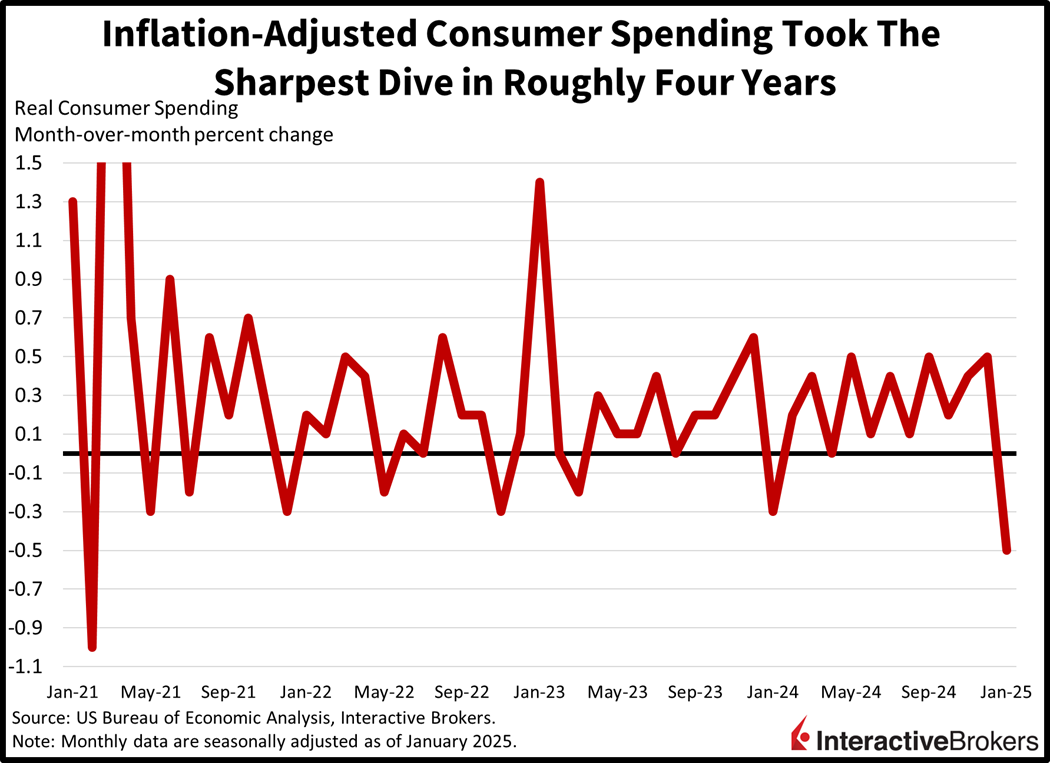
This morning’s personal income and outlays report revealed the largest monthly decline in spending volumes in almost four years, as a return of goods inflation drove consumers away. The real, or inflation-adjusted pace of personal consumption expenditures (PCE), declined 0.5% month over month (m/m) in January, well beneath the median projection of -0.2% and December’s 0.5% gain. Last month’s fall was the steepest since February of 2021, with the pace of durable and non-durable goods outlays declining 3.4% and 0.8% while services rose only 0.1%. The services deceleration was quite notable after transactions grew 0.3% m/m for three months in a row. Personal incomes fared better, however, driven by higher wages and capital gains; the measure’s pace rose 0.9% m/m, beating expectations of 0.3% and December’s 0.4% increase.
Inflation data didn’t provide any surprises within the print, which is preferred by the Federal Reserve when compared to the consumer and producer price indices. The headline and core PCE price indices both increased 0.3% m/m while the annualized figures reflected gains of 2.5% and 2.6%. December’s results came in at 0.3% and 2.6% for headline and 0.2% and 2.9% for core, which excludes food and energy and is considered a better gauge of the trajectory of price pressures. Prices for non-durables, durables and services increased 0.6%, 0.3% and 0.2% during the period. Food and energy increased 0.3% and 1.3%.
Markets are tilted bullishly today as equity investors buy the dip while fixed-income players take the weaker-than-expected consumption data as a reason to add exposure across the curve. And while stock investors see the slowing data as a reason for optimistic about Fed rate cuts, commodity traders perceive the weakening demand as a reason to unload. In equities, all major domestic benchmarks are posting gains with the Nasdaq 100, Russell 2000, S&P 500 and Dow Jones Industrial indices climbing 0.6%, 0.5%, 0.5% and 0.5%. Sector breadth is strongly positive with all 11 major segments participating and led north by consumer discretionary, financials and communication services, which are up 0.9%, 0.9% and 0.8%. We’re seeing some bull steepening action across the yield curve with the 2- and 10-year Treasury maturities changing hands at 4.01% and 4.25%, 4 and 2 basis points (bps) lighter on the session. But softer borrowing costs aren’t weighing on the dollar, which is near the flatline and supported by continued tension on the tariff front. The greenback is appreciating against the pound sterling, franc, yen and Aussie tender but is depreciating relative to the euro, yuan and loonie. Commodities are getting cut except for lumber, which is a significant beneficiary of lighter interest rates as lower financing costs improve home affordability, incentivizing construction. Lumber is up 1.4%, but gold, copper, silver and crude oil are lower by 1%, 1%, 0.6% and 0.4%.
Equity bulls are looking to Washington, D.C., as a reason to buy the dip in stocks today. On the one hand, weaker data prints pointing to a slowing consumer and most importantly, a deteriorating labor market, will lead the Federal Reserve to step in and provide some monetary policy accommodation. While on the other, Wall Street is trying to gauge how much equity downside the White House is willing to take this time around. Folks remember that in the previous Trump administration, dips served as buying opportunities as the Executive Branch would try and sustain elevated animal spirits. This morning’s low happened to be a 5% approximate drop from the S&P 500’s all-time high and bullish investors returned to grapple and defend that level. The risk going forward, however, is that the drop can swell to 10% as earnings prospects begin to wane on the back of trade tensions, persistent inflation and a decelerating consumer.
Canada’s economy achieved a 0.2% m/m growth rate in December, slightly lighter than the 0.3% expected and a monthly recovery after declining 0.2% in November. Statistics Canada says the gains in GDP were attributed to healthy growth in retail sales and a sales tax holiday that started in mid-December.
UK home prices increased at an accelerated pace m/m in February and exceeded analyst expectations even as the country struggles with a weak economy. The Nationwide House Price Index jumped 0.4%, up from January’s gain of 0.1% and above the 0.2% analyst consensus expectation. On a year-over-year (y/y) basis, the indicator climbed 3.9%, exceeding the 3.4% consensus expectation but moderating from the preceding month’s 4.1% rate. February was the sixth-consecutive month of price gains attributed, in part, due to shoppers rushing to sign deals before a higher tax on home purchases starts in April. The average sales price last month was £270,493 or $340,852.
Consumers increased their activities at cash registers for the 34th straight month in January, with transactions increasing 3.9% y/y, matching the analyst consensus estimate and speeding up from 3.5% in December. Relative to the final month of 2024, sales grew 0.5%, reversing from a 0.8% year-end decline. Industrial activity also picked up in January with production growing 2.6% y/y after dropping 1.6% in the preceding month. Conversely, on a m/m basis, industrial production fell 1.1% after sinking 0.2% in December.
Japan also reported that January’s y/y decline in housing starts worsened from -2.5% in December to -4.6%, but construction orders increased from 8.1% to 12.2% y/y.
To learn more about ForecastEx, view our Traders’ Academy video here
New to Interactive Brokers?
Open AccountInformation posted on IBKR Campus that is provided by third-parties does NOT constitute a recommendation that you should contract for the services of that third party. Third-party participants who contribute to IBKR Campus are independent of Interactive Brokers and Interactive Brokers does not make any representations or warranties concerning the services offered, their past or future performance, or the accuracy of the information provided by the third party. Past performance is no guarantee of future results.
This material is from IBKR Macroeconomics, an affiliate of Interactive Brokers LLC, and is being posted with its permission. The views expressed in this material are solely those of the author and/or IBKR Macroeconomics and Interactive Brokers is not endorsing or recommending any investment or trading discussed in the material. This material is not and should not be construed as an offer to buy or sell any security. It should not be construed as research or investment advice or a recommendation to buy, sell or hold any security or commodity. This material does not and is not intended to take into account the particular financial conditions, investment objectives or requirements of individual customers. Before acting on this material, you should consider whether it is suitable for your particular circumstances and, as necessary, seek professional advice.
Interactive Brokers LLC is a CFTC-registered Futures Commission Merchant and a clearing member and affiliate of ForecastEx LLC (“ForecastEx”). ForecastEx is a CFTC-registered Designated Contract Market and Derivatives Clearing Organization. Interactive Brokers LLC provides access to ForecastEx Forecast Contracts for eligible customers. Interactive Brokers LLC does not make recommendations with respect to any products available on its platform, including those offered by ForecastEx.
Futures are not suitable for all investors. The amount you may lose may be greater than your initial investment. Before trading futures, please read the CFTC Risk Disclosure. A copy and additional information are available at ibkr.com.
Related Articles


")


Join The Conversation
For specific platform feedback and suggestions, please submit it directly to our team using these instructions.
If you have an account-specific question or concern, please reach out to Client Services.
We encourage you to look through our FAQs before posting. Your question may already be covered!