
- Solve real problems with our hands-on interface
- Progress from basic puts and calls to advanced strategies
Interactive Options Course
Posted May 8, 2026 at 10:31 am
Investopedia is partnering with All Star Charts on this newsletter. The contents of this newsletter are for informational and educational purposes only.
Wall Street spent a year betting AI would destroy the software industry.
The trade was simple.
Buy the chips that build the AI models. Sell the software companies whose products the AI is supposed to replace.
The bet worked for most of 2025 and the first quarter of 2026, with semiconductor stocks ripping to all-time highs and software stocks falling 24% on the year.
The chart now says the market is starting to change its mind.

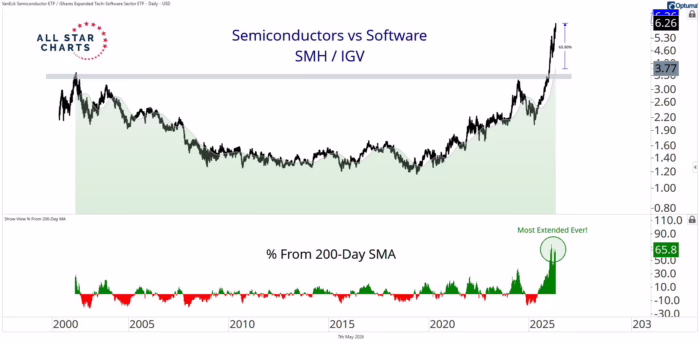
The ratio between the VanEck Semiconductor ETF (SMH) and the iShares Expanded Tech-Software Sector ETF (IGV) is the cleanest way to measure which group is leading inside the technology sector.
SMH holds the 25 largest U.S. semiconductor companies with Nvidia, Broadcom, and AMD as its top weights, while IGV holds the largest U.S. software companies with Microsoft, Oracle, Palantir, and Salesforce as its top weights.
When the ratio rises, semis are outperforming software, and when it falls, software is taking the lead.
Right now, the ratio is sitting 65.8% above its 200-day moving average.
That is the most extended reading the relationship has ever recorded.
For context, the previous extreme came during the 2024 AI rally, when semis pulled away from software for the first time.
That extension was less than half of what we are seeing today.
Leadership moves rarely continue in a straight line forever.
Sectors that pull ahead at this kind of pace tend to consolidate while the lagging group catches up, which is the classical mean reversion setup.
The fundamental story behind the divergence has been the “AI eating SaaS” thesis, the idea that AI tools would replace existing software products and crush margins for the incumbents.
That thesis drove software stocks down for most of the past year while semiconductor stocks rallied on AI infrastructure demand.
The thesis is starting to lose steam.
Palantir, ServiceNow, Atlassian, Twilio, and DataDog all reported strong Q1 2026 earnings in late April, with several names rallying double digits on their prints.
Software analysts at Wedbush and D.A. Davidson have flagged the sector as oversold, and Bloomberg, CNBC, and multiple sell-side desks have called out the same divergence the chart is showing.
The implications for an everyday investor depend on how the rotation plays out.
A confirmed rotation does not mean semis collapse, it means leadership broadens inside technology, with both sectors able to stay positive in absolute terms while the relative trend shifts.
For investors heavily concentrated in semiconductor names, the setup suggests reviewing exposure and considering whether broader technology positioning might be more durable from here, and for investors who have avoided software because of the AI displacement story, the chart is starting to suggest that the worst of the selling may be behind us.
What would invalidate the rotation thesis is straightforward.
If the SMH/IGV ratio continues to extend without consolidating, and software fails to follow through on the recent earnings strength, the divergence could continue and the mean reversion never triggers.
The setup requires confirmation in the form of software stabilization and a flattening of the ratio.
The level to monitor is the 200-day moving average on the SMH/IGV relationship.
A move back toward that level would confirm the rotation is in motion. Until then, the setup is coiled at the most extended reading on record, and the next move could go either way.
If you want to see how I trade this kind of setup in real time, including the specific names I am watching for the rotation, I am hosting a live investor briefing on Thursday, May 14 at 4:30 PM ET called the Fast Money Masterclass.
I will be walking through the proprietary indicator I use to spot fast-moving trades on liquid stocks, with a recent example being an IGV $80 call that doubled in a single day and then ran to +663% over the following week.
The strategy is short-term, the setups are specific, and the entire methodology will be on the table.
Click here to save your seat for the May 14 briefing
—
Originally posted 8th May 2026
Investopedia.com: The comments, opinions and analyses expressed herein are for informational purposes only and should not be considered individual investment advice or recommendations to invest in any security or to adopt any investment strategy. While we believe the information provided herein is reliable, we do not warrant its accuracy or completeness. The views and strategies described on our content may not be suitable for all investors. Because market and economic conditions are subject to rapid change, all comments, opinions and analyses contained within our content are rendered as of the date of the posting and may change without notice. The material is not intended as a complete analysis of every material fact regarding any country, region, market, industry, investment or strategy. This information is intended for US residents only.
Information posted on IBKR Campus that is provided by third-parties does NOT constitute a recommendation that you should contract for the services of that third party. Third-party participants who contribute to IBKR Campus are independent of Interactive Brokers and Interactive Brokers does not make any representations or warranties concerning the services offered, their past or future performance, or the accuracy of the information provided by the third party. Past performance is no guarantee of future results.
This material is from Investopedia and is being posted with its permission. The views expressed in this material are solely those of the author and/or Investopedia and Interactive Brokers is not endorsing or recommending any investment or trading discussed in the material. This material is not and should not be construed as an offer to buy or sell any security. It should not be construed as research or investment advice or a recommendation to buy, sell or hold any security or commodity. This material does not and is not intended to take into account the particular financial conditions, investment objectives or requirements of individual customers. Before acting on this material, you should consider whether it is suitable for your particular circumstances and, as necessary, seek professional advice.
Any discussion or mention of an ETF is not to be construed as recommendation, promotion or solicitation. All investors should review and consider associated investment risks, charges and expenses of the investment company or fund prior to investing. Before acting on this material, you should consider whether it is suitable for your particular circumstances and, as necessary, seek professional advice.
Related Articles


Join The Conversation
For specific platform feedback and suggestions, please submit it directly to our team using these instructions.
If you have an account-specific question or concern, please reach out to Client Services.
We encourage you to look through our FAQs before posting. Your question may already be covered!